Introduction
I am always interested in finding new hardware that is capable of running VPP. Of course, a standard issue 19" rack mountable machine like a Dell, HPE or SuperMicro machine is an obvious choice. They come with redundant power supplies, PCIe v3.0 or better expansion slots, and can boot off of mSATA or NVME, with plenty of RAM. But for some people and in some locations, the power envelope or size/cost of these 19" rack mountable machines can be prohibitive. Sometimes, just having a smaller form factor can be very useful:
Enter the GoWin R86S!
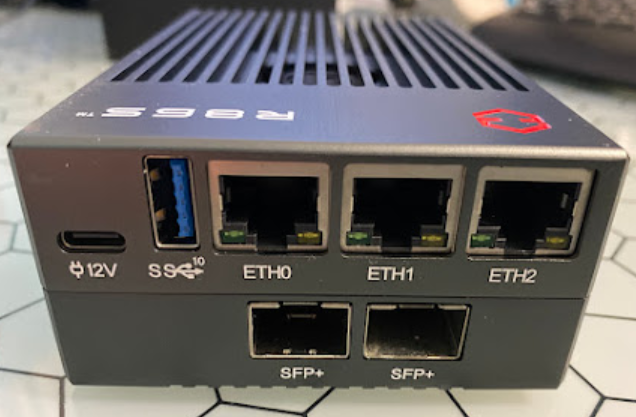
I stumbled across this lesser known build from GoWin, which is an ultra compact but modern design, featuring three 2.5GbE ethernet ports and optionally two 10GbE, or as I’ll show here, two 25GbE ports. What I really liked about the machine is that it comes with 32GB of LPDDR4 memory and can boot off of an m.2 NVME – which makes it immediately an appealing device to put in the field. I noticed that the height of the machine is just a few millimeters smaller than 1U which is 1.75" (44.5mm), which gives me the bright idea to 3D print a bracket to be able to rack these and because they are very compact – a width of 78mm only, I can manage to fit four of them in one 1U front, or maybe a Mikrotik CRS305 breakout switch. Slick!
I picked up two of these R86S Pro and when they arrived, I noticed that their 10GbE is actually
an Open Compute Project (OCP) footprint expansion card, which struck me as clever. It means that I
can replace the Mellanox CX342A network card with perhaps something more modern, such as an Intel
X520-DA2 or Mellanox MCX542B_ACAN which is even dual-25G! So I take to ebay and buy myself a few
expansion OCP boards, which are surprisingly cheap, perhaps because the OCP form factor isn’t as
popular as ’normal’ PCIe v3.0 cards.
I put a Google photos album online [here], in case you’d like some more detailed shots.
In this article, I’ll write about a mixture of hardware, systems engineering (how the hardware like network cards and motherboard and CPU interact with one another), and VPP performance diagnostics. I hope that it helps a few wary Internet denizens feel their way around these challenging but otherwise fascinating technical topics. Ready? Let’s go!
Hardware Specs
For the CHF 314,- I paid for each Intel Pentium N6005, this machine is delightful! They feature:
- Intel Pentium Silver N6005 @ 2.00GHz (4 cores)
- 2x16GB Micron LPDDR4 memory @2933MT/s
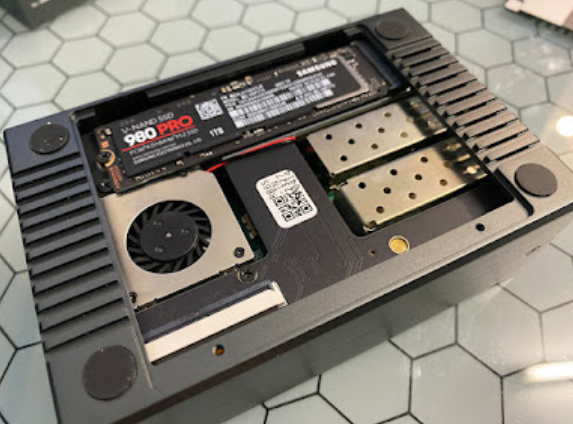
- 1x Samsung SSD 980 PRO 1TB NVME
- 3x Intel I226-V 2.5GbE network ports
- 1x OCP v2.0 connector with PCIe v3.0 x4 delivered
- USB-C power supply
- 2x USB3 (one on front, one on side)
- 1x USB2 (on the side)
- 1x MicroSD slot
- 1x MicroHDMI video out
- Wi-Fi 6 AX201 160MHz onboard
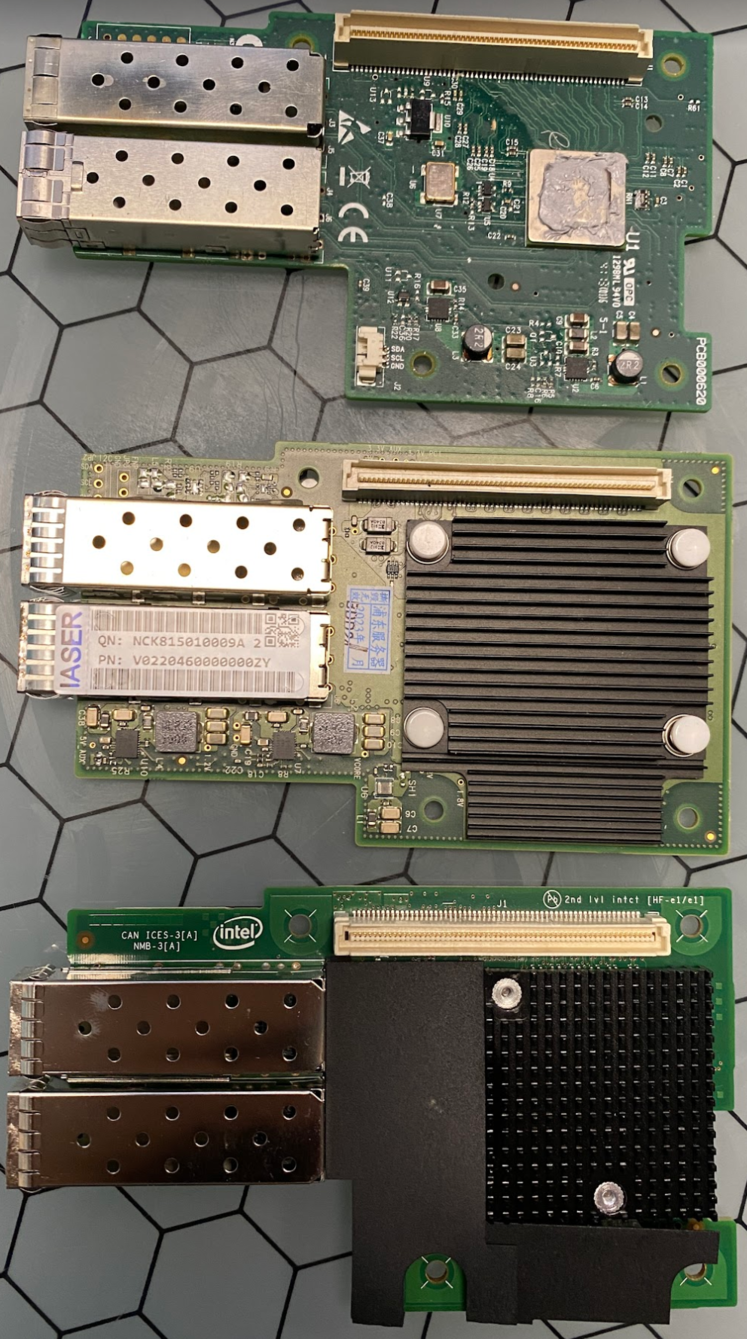
To the right I’ve put the three OCP nework interface cards side by side. On the top, the Mellanox Cx3 (2x10G) that shipped with the R86S units. In the middle, a spiffy Mellanox Cx5 (2x25G), and at the bottom, the classic Intel 82599ES (2x10G) card. As I’ll demonstrate, despite having the same form factor, each of these have a unique story to tell, well beyond their rated portspeed.
There’s quite a few options for CPU out there - GoWin sells them with Jasper Lake (Celeron N5105 or Pentium N6005, the one I bought), but also with newer Alder Lake (N100 or N305). Price, performance and power draw will vary. I looked at a few differences in Passmark, and I think I made a good trade off between cost, power and performance. You may of course choose differently!
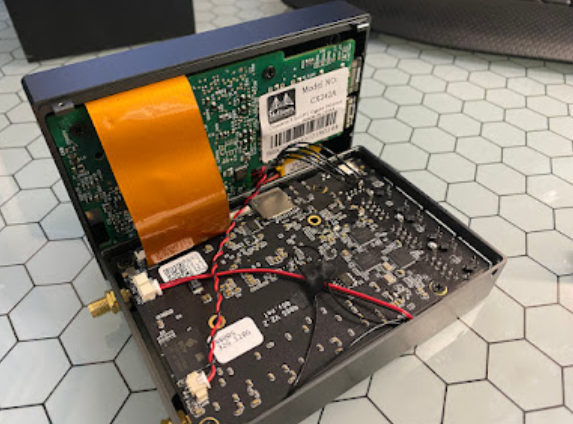
The R86S formfactor is very compact, coming in at (80mm x 120mm x 40mm), and the case is made of sturdy aluminium. It feels like a good quality build, and the inside is also pretty neat. In the kit, a cute little M2 hex driver is included. This allows me to remove the bottom plate (to service the NVME) and separate the case to access the OCP connector (and replace the NIC!). Finally, the two antennae at the back are tri-band, suitable for WiFi 6. There is one fan included in the chassis, with a few cut-outs in the top of the case, to let the air flow through the case. The fan is not noisy, but definitely noticeable.
Compiling VPP on R86S
I first install Debian Bookworm on them, and retrofit one of them with the Intel X520 and the other with the Mellanox Cx5 network cards. While the Mellanox Cx342A that comes with the R86S does have DPDK support (using the MLX4 poll mode driver), it has a quirk in that it does not enumerate both ports as unique PCI devices, causing VPP to crash with duplicate graph node names:
vlib_register_node:418: more than one node named `FiftySixGigabitEthernet5/0/0-tx'
Failed to save post-mortem API trace to /tmp/api_post_mortem.794
received signal SIGABRT, PC 0x7f9445aa9e2c
The way VPP enumerates DPDK devices is by walking the PCI bus, but considering the Connect-X3 has
two ports behind the same PCI address, it’ll try to create two interfaces, which fails. It’s pretty
easily fixable with a small [patch]. Off I go, to compile VPP (version
24.10-rc0~88-ge3469369dd) with Mellanox DPDK support, to get the best side by side comparison
between the Cx3 and X520 cards on the one hand needing DPDK, and the Cx5 card optionally also being
able to use VPP’s RDMA driver. They will all be using DPDK in my tests.
I’m not out of the woods yet, because VPP throws an error when enumerating and attaching the
Mellanox Cx342. I read the DPDK documentation for this poll mode driver
[ref] and find that when using DPDK applications, the
mlx4_core driver in the kernel has to be initialized with a specific flag, like so:
GRUB_CMDLINE_LINUX_DEFAULT="isolcpus=1-3 iommu=on intel_iommu=on mlx4_core.log_num_mgm_entry_size=-1"
And because I’m using iommu, the correct driver to load for Cx3 is vfio_pci, so I put that in
/etc/modules, rebuild the initrd, and reboot the machine. With all of that sleuthing out of the
way, I am now ready to take the R86S out for a spin and see how much this little machine is capable
of forwarding as a router.
Power: Idle and Under Load
I note that the Intel Pentium Silver CPU has 4 cores, one of which will be used by OS and controlplane, leaving 3 worker threads left for VPP. The Pentium Silver N6005 comes with 32kB of L1 per core, and 1.5MB of L2 + 4MB of L3 cache shared between the cores. It’s not much, but then again the TDP is shockingly low 10 Watts. Before VPP runs (and makes the CPUs work really hard), the entire machine idles at 12 Watts. When powered on under full load, the Mellanox Cx3 and Intel x520-DA2 both sip 17 Watts of power and the Mellanox Cx5 slurps 20 Watts of power all-up. Neat!
Loadtest Results
For each network interface I will do a bunch of loadtests, to show different aspects of the setup. First, I’ll do a bunch of unidirectional tests, where traffic goes into one port and exits another. I will do this with either large packets (1514b), small packets (64b) but many flows, which allow me to use multiple hardware receive queues assigned to individual worker threads, or small packets with only one flow, limiting VPP to only one RX queue and consequently only one CPU thread. Because I think it’s hella cool, I will also loadtest MPLS label switching (eg. MPLS frame with label ‘16’ on ingress, forwarded with a swapped label ‘17’ on egress). In general, MPLS lookups can be a bit faster as they are (constant time) hashtable lookups, while IPv4 longest prefix match lookups use a trie. MPLS won’t be significantly faster than IPv4 in these tests, because the FIB is tiny with only a handful of entries.
Second, I’ll do the same loadtests but in both directions, which means traffic is both entering NIC0 and being emitted on NIC1, but also entering on NIC1 to be emitted on NIC0. In these loadtests, again large packets, small packets multi-flow, small packets single-flow, and MPLS, the network chip has to do more work to maintain its RX queues and its TX queues simultaneously. As I’ll demonstrate, this tends to matter quite a bit on consumer hardware.
Intel i226-V (2.5GbE)
This is a 2.5G network interface from the Foxville family, released in Q2 2022 with a ten year expected availability, it’s currently a very good choice. It is a consumer/client chip, which means I cannot expect super performance from it. In this machine, the three RJ45 ports are connected to PCI slot 01:00.0, 02:00.0 and 03:00.0, each at 5.0GT/s (this means they are PCIe v2.0) and they take one x1 PCIe lane to the CPU. I leave the first port as management, and take the second+third one and give them to VPP like so:
dpdk {
  dev 0000:02:00.0 { name e0 }
  dev 0000:03:00.0 { name e1 }
  no-multi-seg
  decimal-interface-names
  uio-driver vfio-pci
}
The logical configuration then becomes:
set int state e0 up
set int state e1 up
set int ip address e0 100.64.1.1/30
set int ip address e1 100.64.2.1/30
ip route add 16.0.0.0/24 via 100.64.1.2
ip route add 48.0.0.0/24 via 100.64.2.2
ip neighbor e0 100.64.1.2 50:7c:6f:20:30:70
ip neighbor e1 100.64.2.2 50:7c:6f:20:30:71

mpls table add 0
set interface mpls e0 enable
set interface mpls e1 enable
mpls local-label add 16 eos via 100.64.2.2 e1
mpls local-label add 17 eos via 100.64.1.2 e0
In the first block, I’ll bring up interfaces e0 and e1, give them an IPv4 address in a /30
transit net, and set a route to the other side. I’ll route packets destined to 16.0.0.0/24 to the
Cisco T-Rex loadtester at 100.64.1.2, and I’ll route packets for 48.0.0.0/24 to the T-Rex at
100.64.2.2. To avoid the need to ARP for T-Rex, I’ll set some static ARP entries to the loadtester’s
MAC addresses.
In the second block, I’ll enable MPLS, turn it on on the two interfaces, and add two FIB entries. If
VPP receives an MPLS packet with label 16, it’ll forward it on to Cisco T-Rex on port e1, and if it
receives a packet with label 17, it’ll forward it to T-Rex on port e0.
Without further ado, here are the results of the i226-V loadtest:
| Intel i226-V: Loadtest | L2 bits/sec | Packets/sec | % of Line-Rate |
|---|---|---|---|
| Unidirectional 1514b | 2.44Gbps | 202kpps | 99.4% |
| Unidirectional 64b Multi | 1.58Gbps | 3.28Mpps | 88.1% |
| Unidirectional 64b Single | 1.58Gbps | 3.28Mpps | 88.1% |
| Unidirectional 64b MPLS | 1.57Gbps | 3.27Mpps | 87.9% |
| Bidirectional 1514b | 4.84Gbps | 404kpps | 99.4% |
| Bidirectional 64b Multi | 2.44Gbps | 5.07Mpps | 68.2% |
| Bidirectional 64b Single | 2.44Gbps | 5.07Mpps | 68.2% |
| Bidirectional 64b MPLS | 2.43Gbps | 5.07Mpps | 68.2% |
First response: very respectable!
Important Notes
1. L1 vs L2
There’s a few observations I want to make, as these numbers can be confusing. First off, VPP when
given large packets, can easily sustain almost exactly (!) the line rate of 2.5GbE. There’s always a
debate about these numbers, so let me offer offer some theoretical background –
- The L2 Ethernet frame that Cisco T-Rex sends consists of the source/destination MAC (6
bytes each), a type (2 bytes), the payload, and a frame checksum (4 bytes). It shows us this
number as
Tx bps L2. - But on the wire, the PHY has to additionally send a preamble (7 bytes), a start frame
delimiter (1 byte), and at the end, an interpacket gap (12 bytes), which is 20 bytes of
overhead. This means that the total size on the wire will be 1534 bytes. It shows us this
number as
Tx bps L1. - This 1534 byte L1 frame on the wire is 12272 bits. For a 2.5Gigabit line rate, this means we
can send at most 2'500'000'000 / 12272 = 203715 packets per second. Regardless of L1 or L2,
this number is always
Tx pps. - The smallest (L2) Ethernet frame we’re allowed to send, is 64 bytes, and anything shorter than this is called a Runt. On the wire, such a frame will be 84 bytes (672 bits). With 2.5GbE, this means 3.72Mpps is the theoretical maximum.
When reading back loadtest results from Cisco T-Rex, it shows us packets per second (Rx pps), but it
only shows us the Rx bps, which is the L2 bits/sec which corresponds to the sending port’s Tx bps L2. When I describe the percentage of Line-Rate, I calculate this with what physically fits on
the wire, eg the L1 bits/sec, because that makes most sense to me.
When sending small 64b packets, the difference is significant: taking the above Unidirectional 64b Single as an example, I observed 3.28M packets/sec. This is a bandwidth of 3.28M*64*8 = 1.679Gbit of L2 traffic, but a bandwidth of 3.28M*(64+20)*8 = 2.204Gbit of L1 traffic, which is how I determine that it is 88.1% of Line-Rate.
2. One RX queue
A less pedantic observation is that there is no difference between Multi and Single flow
loadtests. This is because the NIC only uses one RX queue, and therefor only one VPP worker thread.
I did do a few loadtests with multiple receive queues, but it does not matter for performance. When
performing this 3.28Mpps of load, I can see that VPP itself is not saturated. I can see that most of
the time it’s just sitting there waiting for DPDK to give it work, which manifests as a vectors/call
relatively low:
---------------
Thread 2 vpp_wk_1 (lcore 2)
Time 10.9, 10 sec internal node vector rate 40.39 loops/sec 68325.87
  vector rates in 3.2814e6, out 3.2814e6, drop 0.0000e0, punt 0.0000e0
             Name       State       Calls     Vectors    Suspends    Clocks    Vectors/Call
dpdk-input              polling     61933     2846586           0    1.28e2           45.96
ethernet-input          active      61733     2846586           0    1.71e2           46.11
ip4-input-no-checksum   active      61733     2846586           0    6.54e1           46.11
ip4-load-balance        active      61733     2846586           0    4.70e1           46.11
ip4-lookup              active      61733     2846586           0    7.50e1           46.11
ip4-rewrite             active      61733     2846586           0    7.23e1           46.11
e1-output               active      61733     2846586           0    2.53e1           46.11
e1-tx                   active      61733     2846586           0    1.38e2           46.11
By the way the other numbers here are fascinating as well. Take a look at them:
- Calls: How often has VPP executed this graph node.
- Vectors: How many packets (which are internally called vectors) have been handled.
- Vectors/Call: Every time VPP executes the graph node, on average how many packets are done at once? An unloaded VPP will hover around 1.00, and the maximum permissible is 256.00.
- Clocks: How many CPU cycles, on average, did each packet spend in each graph node. Interestingly, summing up this number gets very close to the total CPU clock cycles available (on this machine 2.4GHz).
Zooming in on the clocks number a bit more: every time a packet was handled, roughly 594 CPU cycles were spent in VPP’s directed graph. An additional 128 CPU cycles were spent asking DPDK for work. Summing it all up, 3.28M*(594+128) = 2'369'170'800 which is earily close to the 2.4GHz I mentioned above. I love it when the math checks out!!
By the way, in case you were wondering what happens on an unloaded VPP thread, the clocks spent
in dpdk-input (and other polling nodes like unix-epoll-input) just go up to consume the whole
core. I explain that in a bit more detail below.
3. Uni- vs Bidirectional
I noticed a non-linear response between loadtests in one direction versus both directions. At large
packets, it did not matter. Both directions satured the line nearly perfectly (202kpps in one
direction, and 404kpps in both directions). However, in the smaller packets, some contention became
clear. In only one direction, IPv4 and MPLS forwarding were roughly 3.28Mpps; but in both
directions, this went down to 2.53Mpps in each direction (which is my reported 5.07Mpps). So it’s
interesting to see how these i226-V chips do seem to care if they are only receiving or transmitting
transmitting, or performing both receiving and transmitting.
Intel X520 (10GbE)

This network card is based on the classic Intel Niantic chipset, also known as the 82599ES chip,
first released in 2009. It’s super reliable, but there is one downside. It’s a PCIe v2.0 device
(5.0GT/s) and to be able to run two ports, it will need eight lanes of PCI connectivity. However, a
quick inspection using dmesg shows me, that there are only 4 lanes brought to the OCP connector:
ixgbe 0000:05:00.0: 16.000 Gb/s available PCIe bandwidth, limited by 5.0 GT/s PCIe x4 link
                    at 0000:00:1c.4 (capable of 32.000 Gb/s with 5.0 GT/s PCIe x8 link)
ixgbe 0000:05:00.0: MAC: 2, PHY: 1, PBA No: H31656-000
ixgbe 0000:05:00.0: 90:e2:ba:c5:c9:38
ixgbe 0000:05:00.0: Intel(R) 10 Gigabit Network Connection
That’s a bummer! Because there are two Tengig ports on this OCP, and this chip is a PCIe v2.0 device which means the PCI encoding will be 8b/10b which means each lane can deliver about 80% of the 5.0GT/s, and 80% of 20GT/s is 16.0Gbit. By the way, when PCIe v3.0 was released, not only did the transfer speed go to 8.0GT/s per lane, the encoding also changed to 128b/130b which lowers the overhead from a whopping 20% to only 1.5%. It’s not a bad investment of time to read up on PCI Express standards on [Wikipedia], as PCIe limitations and blocked lanes (like in this case!) are the number one reason for poor VPP performance, as my buddy Sander also noted during my NLNOG talk last year.
Intel X520: Loadtest Results
Now that I’ve shown a few of these runtime statistics, I think it’s good to review three pertinent graphs. I proceed to hook up the loadtester to the 10G ports of the R86S unit that has the Intel X520-DA2 adapter. I’ll run the same eight loadtests: {1514b,64b,64b-1Q,MPLS} x {unidirectional,bidirectional}
In the table above, I showed the output of show runtime in the VPP debug CLI. These numbers are
also exported in a prometheus exporter. I wrote about that in this [article]. In Grafana, I can draw these timeseries as graphs, and it shows me a lot
about where VPP is spending its time. Each node in the directed graph counts how many vectors
(packets) it has seen, and how many CPU cycles it has spent doing its work.
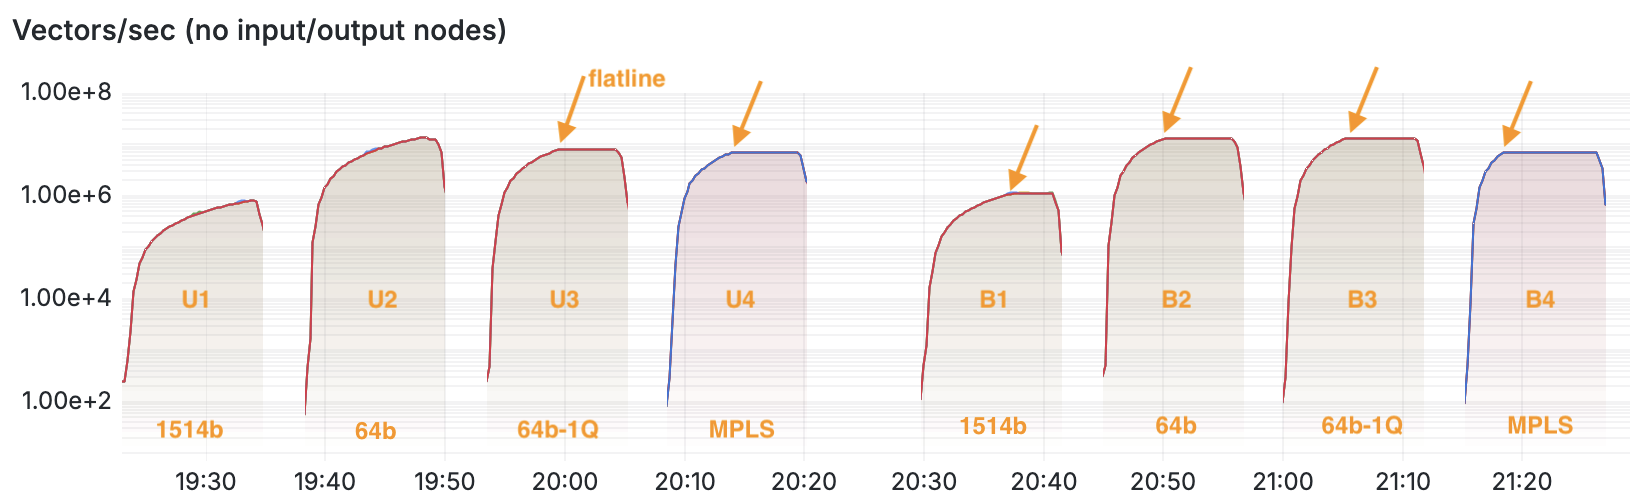
In VPP, a graph of vectors/sec means how many packets per second is the router forwarding. The graph above is on a logarithmic scale, and I’ve annotated each of the eight loadtests in orange. The first block of four are the Unidirectional tests and of course, higher values is better.
I notice that some of these loadtests ramp up until a certain point, after which they become a flatline, which I drew orange arrows for. The first time this clearly happens is in the U3 loadtest. It makes sense to me, because having one flow implies only one worker thread, whereas in the U2 loadtest the system can make use of multiple receive queues and therefore multiple worker threads. It stands to reason that U2 has a slightly better performance than U3.
The fourth test, the MPLS loadtest, is forwarding the same identical packets with label 16, out on another interface with label 17. They are therefore also single flow, and this explains why the U4 loadtest looks very similar to the U3 one. Some NICs can hash MPLS traffic to multiple receive queues based on the inner payload, but I conclude that the Intel X520-DA2 aka 82599ES cannot do that.
The second block of four are the Bidirectional tests. Similar to the tests I did with the i226-V 2.5GbE NICs, here each of the network cards has to both receive traffic as well as sent traffic. It is with this graph that I can determine the overall throughput in packets/sec of these network interfaces. Of course the bits/sec and packets/sec also come from the T-Rex loadtester output JSON. Here they are, for the Intel X520-DA2:
| Intel 82599ES: Loadtest | L2 bits/sec | Packets/sec | % of Line-Rate |
|---|---|---|---|
| U1: Unidirectional 1514b | 9.77Gbps | 809kpps | 99.2% |
| U2: Unidirectional 64b Multi | 6.48Gbps | 13.4Mpps | 90.1% |
| U3: Unidirectional 64b Single | 3.73Gbps | 7.77Mpps | 52.2% |
| U4: Unidirectional 64b MPLS | 3.32Gbps | 6.91Mpps | 46.4% |
| B1: Bidirectional 1514b | 12.9Gbps | 1.07Mpps | 65.6% |
| B2: Bidirectional 64b Multi | 6.08Gbps | 12.7Mpps | 42.7% |
| B3: Bidirectional 64b Single | 6.25Gbps | 13.0Mpps | 43.7% |
| B4: Bidirectional 64b MPLS | 3.26Gbps | 6.79Mpps | 22.8% |
A few further observations:
- U1’s loadtest shows that the machine can sustain 10Gbps in one direction, while B1 shows that bidirectional loadtests are not yielding twice as much throughput. This is very likely because the PCIe 5.0GT/s x4 link is constrained to 16Gbps total throughput, while the OCP NIC supports PCIe 5.0GT/s x8 (32Gbps).
- U3’s loadtest shows that one single CPU can do 7.77Mpps max, if it’s the only CPU that is doing work. This is likely because if it’s the only thread doing work, it gets to use the entire L2/L3 cache for itself.
- U2’s test shows that when multiple workers perform work, the throughput raises to 13.4Mpps, but this is not double that of a single worker. Similar to before, I think this is because the threads now need to share the CPU’s modest L2/L3 cache.
- B3’s loadtest shows that two CPU threads together can do 6.50Mpps each (for a total of 13.0Mpps), which I think is likely because each NIC now has to receive and transit packets.
If you’re reading this and think you have an alternative explanation, do let me know!
Mellanox Cx3 (10GbE)
When VPP is doing its work, it typically asks DPDK (or other input types like virtio, AVF, or RDMA)
for a list of packets, rather than one individual packet. It then brings these packets, called
vectors, through a directed acyclic graph inside of VPP. Each graph node does something specific to
the packets, for example in ethernet-input, the node checks what ethernet type each packet is (ARP,
IPv4, IPv6, MPLS, …), and hands them off to the correct next node, such as ip4-input or mpls-input.
If VPP is idle, there may be only one or two packets in the list, which means every time the packets
go into a new node, a new chunk of code has to be loaded from working memory into the CPU’s
instruction cache. Conversely, if there are many packets in the list, only the first packet may need
to pull things into the i-cache, the second through Nth packet will become cache hits and execute
much faster. Moreover, some nodes in VPP make use of processor optimizations like SIMD (single
instruction, multiple data), to save on clock cycles if the same operation needs to be executed
multiple times.
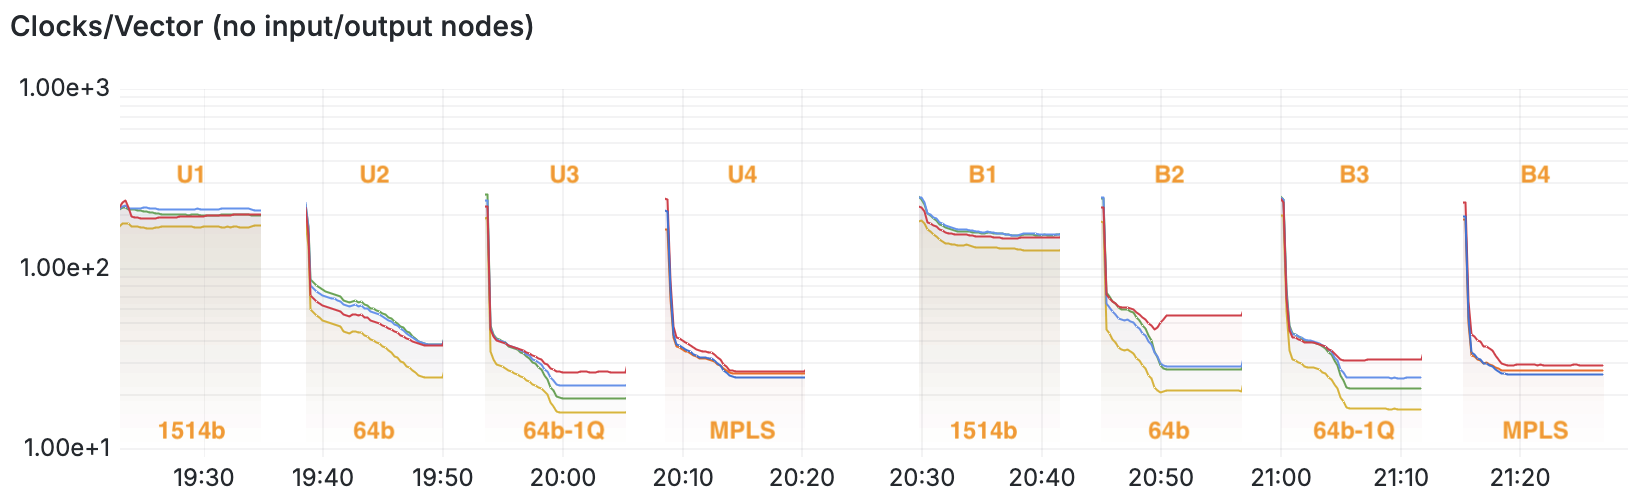
This graph shows the average CPU cycles per packet for each node. In the first three loadtests
(U1, U2 and U3), you can see four lines representing the VPP nodes ip4-input
ip4-lookup, ip4-load-balance and ip4-rewrite. In the fourth loadtest U4, you can see
only three nodes: mpls-input, mpls-lookup, and ip4-mpls-label-disposition-pipe (where the MPLS
label ‘16’ is swapped for outgoing label ‘17’).
It’s clear to me that when VPP has not many packets/sec to route (ie U1 loadtest), that the cost per packet is actually quite high at around 200 CPU cycles per packet per node. But, if I slam the VPP instance with lots of packets/sec (ie U3 loadtest), that VPP gets much more efficient at what it does. What used to take 200+ cycles per packet, now only takes between 34-52 cycles per packet, which is a whopping 5x increase in efficiency. How cool is that?!
And with that, the Mellanox C3 loadtest completes, and the results are in:
| Mellanox MCX342A-XCCN: Loadtest | L2 bits/sec | Packets/sec | % of Line-Rate |
|---|---|---|---|
| U1: Unidirectional 1514b | 9.73Gbps | 805kpps | 99.7% |
| U2: Unidirectional 64b Multi | 1.11Gbps | 2.30Mpps | 15.5% |
| U3: Unidirectional 64b Single | 1.10Gbps | 2.27Mpps | 15.3% |
| U4: Unidirectional 64b MPLS | 1.10Gbps | 2.27Mpps | 15.3% |
| B1: Bidirectional 1514b | 18.7Gbps | 1.53Mpps | 94.9% |
| B2: Bidirectional 64b Multi | 1.54Gbps | 2.29Mpps | 7.69% |
| B3: Bidirectional 64b Single | 1.54Gbps | 2.29Mpps | 7.69% |
| B4: Bidirectional 64b MPLS | 1.54Gbps | 2.29Mpps | 7.69% |
Here’s something that I find strange though. VPP is clearly not saturated by these 64b loadtests. I know this, because in the case of the Intel X520-DA2 above, I could easily see 13Mpps in a bidirectional test, yet with this Mellanox Cx3 card, no matter if I do one direction or both directions, the max packets/sec tops at 2.3Mpps only – that’s an order of magnitude lower.
Looking at VPP, both worker threads (the one reading from Port 5/0/0, and the other reading from Port 5/0/1), are not very busy at all. If a VPP worker thread is saturated, this typically shows as a vectors/call of 256.00 and 100% of CPU cycles consumed. But here, that’s not the case at all, and most time is spent in DPDK waiting for traffic:
Thread 1 vpp_wk_0 (lcore 1)
Time 31.2, 10 sec internal node vector rate 2.26 loops/sec 988626.15
  vector rates in 1.1521e6, out 1.1521e6, drop 0.0000e0, punt 0.0000e0
             Name                 State       Calls     Vectors   Suspends   Clocks  Vectors/Call
FiftySixGigabitEthernet5/0/1-o   active    15949560    35929200          0   8.39e1          2.25
FiftySixGigabitEthernet5/0/1-t   active    15949560    35929200          0   2.59e2          2.25
dpdk-input                       polling   36250611    35929200          0   6.55e2           .99
ethernet-input                   active    15949560    35929200          0   2.69e2          2.25
ip4-input-no-checksum            active    15949560    35929200          0   1.01e2          2.25
ip4-load-balance                 active    15949560    35929200          0   7.64e1          2.25
ip4-lookup                       active    15949560    35929200          0   9.26e1          2.25
ip4-rewrite                      active    15949560    35929200          0   9.28e1          2.25
unix-epoll-input                 polling      35367           0          0   1.29e3          0.00
---------------
Thread 2 vpp_wk_1 (lcore 2)
Time 31.2, 10 sec internal node vector rate 2.43 loops/sec 659534.38
  vector rates in 1.1517e6, out 1.1517e6, drop 0.0000e0, punt 0.0000e0
             Name                 State       Calls     Vectors   Suspends   Clocks  Vectors/Call
FiftySixGigabitEthernet5/0/0-o   active    14845221    35913927          0   8.66e1          2.42
FiftySixGigabitEthernet5/0/0-t   active    14845221    35913927          0   2.72e2          2.42
dpdk-input                       polling   23114538    35913927          0   6.99e2          1.55
ethernet-input                   active    14845221    35913927          0   2.65e2          2.42
ip4-input-no-checksum            active    14845221    35913927          0   9.73e1          2.42
ip4-load-balance                 active    14845220    35913923          0   7.17e1          2.42
ip4-lookup                       active    14845221    35913927          0   9.03e1          2.42
ip4-rewrite                      active    14845221    35913927          0   8.97e1          2.42
unix-epoll-input                 polling      22551           0          0   1.37e3          0.00

I kind of wonder why that is. Is the Mellanox Connect-X3 such a poor performer? Or does it not like small packets? I’ve read online that Mellanox cards do some form of message compression on the PCI bus, something perhaps to turn off. I don’t know, but I don’t like it!
Mellanox Cx5 (25GbE)
VPP has a few polling nodes, which are pieces of code that execute back-to-back in a tight
execution loop. A classic example of a polling node is a Poll Mode Driver from DPDK: this will
ask the network cards if they have any packets, and if so: marshall them through the directed graph
of VPP. As soon as that’s done, the node will immediately ask again. If there is no work to do, this
turns into a tight loop with DPDK continuously asking for work. There is however another, lesser
known, polling node: unix-epoll-input. This node services a local pool of file descriptors, like
the Linux Control Plane netlink socket for example, or the clients attached to the Statistics
segment, CLI or API. You can see the open files with show unix files.
This design explains why the CPU load of a typical DPDK application is 100% of each worker thread. As
an aside, you can ask the PMD to start off in interrupt mode, and only after a certain load switch
seemlessly to polling mode. Take a look at set interface rx-mode on how to change from polling
to interrupt or adaptive modes. For performance reasons, I always leave the node in polling
mode (the default in VPP).
The stats segment shows how many clock cycles are being spent in each call of each node. It also
knows how often nodes are called. Considering the unix-epoll-input and dpdk-input nodes will
perform what is essentially a tight-loop, the CPU should always add up to 100%. I found that one
cool way to show how busy a VPP instance really is, is to look over all CPU threads, and sort
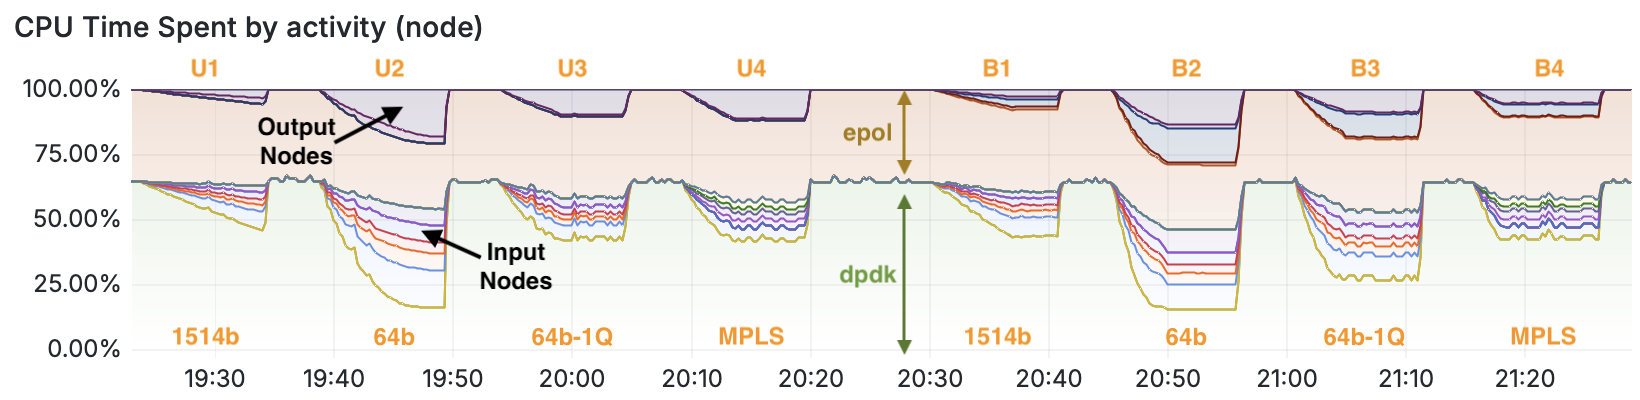
through the fraction of time spent in each node:
- Input Nodes: are those which handle the receive path from DPDK and into the directed graph
for routing – for example
ethernet-input, thenip4-inputthrough toip4-lookupand finallyip4-rewrite. This is where VPP usually spends most of its CPU cycles. - Output Nodes: are those which handle the transmit path into DPDK. You’ll see these are
nodes whose name ends in
-outputor-tx. You can also see that in U2, there are only two nodes consuming CPU, while in B2 there are four nodes (because two interfaces are transmitting!) - epoll: the polling node called
unix-epoll-inputdepicted in brown in this graph. - dpdk: the polling node called
dpdk-inputdepicted in green in this graph.
If there is no work to do, as was the case at around 20:30 in the graph above, the dpdk and epoll nodes are the only two that are consuming CPU. If there’s lots of work to do, as was the case in the unidirectional 64b loadtest between 19:40-19:50, and the bidirectional 64b loadtest between 20:45-20:55, I can observe lots of other nodes doing meaningful work, ultimately starving the dpdk and epoll threads until an equilibrium is achieved. This is how I know the VPP process is the bottleneck and not, for example, the PCI bus.
I let the eight loadtests run, and make note of the bits/sec and packets/sec for each, in this table for the Mellanox Cx5:
| Mellanox MCX542_ACAT: Loadtest | L2 bits/sec | Packets/sec | % of Line-Rate |
|---|---|---|---|
| U1: Unidirectional 1514b | 24.2Gbps | 2.01Mpps | 98.6% |
| U2: Unidirectional 64b Multi | 7.43Gbps | 15.5Mpps | 41.6% |
| U3: Unidirectional 64b Single | 3.52Gbps | 7.34Mpps | 19.7% |
| U4: Unidirectional 64b MPLS | 7.34Gbps | 15.3Mpps | 46.4% |
| B1: Bidirectional 1514b | 24.9Gbps | 2.06Mpps | 50.4% |
| B2: Bidirectional 64b Multi | 6.58Gbps | 13.7Mpps | 18.4% |
| B3: Bidirectional 64b Single | 3.15Gbps | 6.55Mpps | 8.81% |
| B4: Bidirectional 64b MPLS | 6.55Gbps | 13.6Mpps | 18.3% |
Some observations:
- This Mellanox Cx5 runs quite a bit hotter than the other two cards. It’s a PCIe v3.0 which means that despite there only being 4 lanes to the OCP port, it can achieve 31.504 Gbit/s (in case you’re wondering, this is 128b/130b encoding on 8.0GT/s x4).
- It easily saturates 25Gbit in one direction with big packets in U1, but as soon as smaller packets are offered, each worker thread tops out at 7.34Mpps or so in U2.
- When testing in both directions, each thread can do about 6.55Mpps or so in B2. Similar to the other NICs, there is a clear slowdown due to CPU cache contention (when using multiple threads), and RX/TX simultaneously (when doing bidirectional tests).
- MPLS is a lot faster – nearly double based on the use of multiple threads. I think this is because the Cx5 has a hardware hashing function for MPLS packets that looks at the inner payload to sort the traffic into multiple queues, while the Cx3 and Intel X520-DA2 do not.
Summary and closing thoughts
There’s a lot to say about these OCP cards. While the Intel is cheap, the Mellanox Cx3 is a bit quirky with its VPP enumeration, and the Mellanox Cx5 is a bit more expensive (and draws a fair bit more power, coming in at 20W), but it do 25Gbit reasonably, it’s pretty difficult to make a solid recommendation. What I find interesting is the very low limit in packets/sec on 64b packets coming from the Cx3, while at the same time there seems to be an added benefit in MPLS hashing that the other two cards do not have.
All things considered, I think I would recommend the Intel x520-DA2 (based on the Niantic chip, Intel 82599ES, total machine coming in at 17W). It seems like it pairs best with the available CPU on the machine. Maybe a Mellanox ConnectX-4 could be a good alternative though, hmmmm :)
Here’s a few files I gathered along the way, in case they are useful:
- [LSCPU] - [Likwid Topology] - [DMI Decode] - [LSBLK]
- Mellanox Cx341: [dmesg] - [LSPCI] - [LSHW] - [VPP Patch]
- Mellanox Cx542: [dmesg] - [LSPCI] - [LSHW]
- Intel X520-DA2: [dmesg] - [LSPCI] - [LSHW]
- VPP Configs: [startup.conf] - [L2 Config] - [L3 Config] - [MPLS Config]