Introduction

In January of 2023, an uncomfortably long time ago at this point, an acquaintance of mine called Ciprian reached out to me after seeing my [DENOG #14] presentation. He was interested to learn about IPFIX and was asking if sFlow would be an option. At the time, there was a plugin in VPP called [flowprobe] which is able to emit IPFIX records. Unfotunately I never really got it to work well in my tests, as either the records were corrupted, sub-interfaces didn’t work, or the plugin would just crash the dataplane entirely. In the meantime, the folks at [Netgate] submitted quite a few fixes to flowprobe, but it remains an expensive operation computationally. Wouldn’t copying one in a thousand or ten thousand packet headers with flow sampling not be just as good?
In the months that followed, I discussed the feature with the incredible folks at [inMon], the original designers and maintainers of the sFlow protocol and toolkit. Neil from inMon wrote a prototype and put it on [GitHub] but for lack of time I didn’t manage to get it to work, which was largely my fault by the way.
However, I have a bit of time on my hands in September and October, and just a few weeks ago, my buddy Pavel from [FastNetMon] pinged that very dormant thread about sFlow being a potentially useful tool for anti DDoS protection using VPP. And I very much agree!
sFlow: Protocol
Maintenance of the protocol is performed by the [sFlow.org] consortium, the authoritative source of the sFlow protocol specifications. The current version of sFlow is v5.
sFlow, short for sampled Flow, works at the ethernet layer of the stack, where it inspects one in N datagrams (typically 1:1000 or 1:10000) going through the physical network interfaces of a device. On the device, an sFlow Agent does the sampling. For each sample the Agent takes, the first M bytes (typically 128) are copied into an sFlow Datagram. Sampling metadata is added, such as the ingress (or egress) interface and sampling process parameters. The Agent can then optionally add forwarding information (such as router source- and destination prefix, MPLS LSP information, BGP communties, and what-not). Finally the Agent will periodically read the octet and packet counters of physical network interface(s). Ultimately, the Agent will send the samples and additional information over the network as a UDP datagram, to an sFlow Collector for further processing.
sFlow has been specifically designed to take advantages of the statistical properties of packet sampling and can be modeled using statistical sampling theory. This means that the sFlow traffic monitoring system will always produce statistically quantifiable measurements. You can read more about it in Peter Phaal and Sonia Panchen’s [paper], I certainly did and my head spun a little bit at the math :)
sFlow: Netlink PSAMPLE
sFlow is meant to be a very lightweight operation for the sampling equipment. It can typically be done in hardware, but there also exist several software implementations. One very clever thing, I think, is decoupling the sampler from the rest of the Agent. The Linux kernel has a packet sampling API called [PSAMPLE], which allows producers to send samples to a certain group, and then allows consumers to subscribe to samples of a certrain group. The PSAMPLE API uses [NetLink] under the covers. The cool thing, for me anyway, is that I have a little bit of experience with Netlink due to my work on VPP’s [Linux Control Plane] plugin.
The idea here is that some sFlow Agent, notably a VPP plugin, will be taking periodic samples from the physical network interfaces, and producing Netlink messages. Then, some other program, notably outside of VPP, can consume these messages and further handle them, creating UDP packets with sFlow samples and counters and other information, and sending them to an sFlow Collector somewhere else on the network.

There’s a handy utility called [psampletest] which can
subscribe to these PSAMPLE netlink groups and retrieve the samples. The first time I used all of
this stuff, I wasn’t aware of this utility and I kept on getting errors. It turns out, there’s a
kernel module that needs to be loaded: modprobe psample and psampletest helpfully does that for
you [ref], so just make sure
the module is loaded and added to /etc/modules before you spend as many hours as I did pulling out
hair.
VPP: sFlow Plugin
For the purposes of my initial testing, I’ll simply take a look at Neil’s prototype on [GitHub] and see what I learn in terms of functionality and performance.
sFlow Plugin: Anatomy
The design is purposefully minimal, to do all of the heavy lifting outside of the VPP dataplane. The
plugin will create a new VPP graph node called sflow, which the operator can insert after
device-input, in other words, if enabled, the plugin will get a copy of all packets that are read
from an input provider, such as dpdk-input or rdma-input. The plugin’s job is to process the
packet, and if it’s not selected for sampling, just move it onwards to the next node, typically
ethernet-input. Almost all of the interesting action is in node.c
The kicker is, that one in N packets will be selected to sample, after which:
- the ethernet header (
*en) is extracted from the packet - the input interface (
hw_if_index) is extracted from the VPP buffer. Remember, sFlow works with physical network interfaces! - if there are too many samples from this worker thread being worked on, it is discarded and an error counter is incremented. This protects the main thread from being slammed with samples if there are simply too many being fished out of the dataplane.
- Otherwise:
- a new
sflow_sample_tis created, with all the sampling process metadata filled in - the first 128 bytes of the packet are copied into the sample
- an RPC is dispatched to the main thread, which will send the sample to the PSAMPLE channel
- a new
Both a debug CLI command and API call are added:
sflow enable-disable <interface-name> [<sampling_N>]|[disable]
Some observations:
First off, the sampling_N in Neil’s demo is a global rather than per-interface setting. It would make sense to make this be per-interface, as routers typically have a mixture of 1G/10G and faster 100G network cards available. It was a surprise when I set one interface to 1:1000 and the other to 1:10000 and then saw the first interface change its sampling rate also. It’s a small thing, and will not be an issue to change.

Secondly, sending the RPC to main uses vl_api_rpc_call_main_thread(), which
requires a spinlock in src/vlibmemory/memclnt_api.c:649. I’m somewhat worried that when many
samples are sent from many threads, there will be lock contention and performance will suffer.
sFlow Plugin: Functional
I boot up the [IPng Lab] and install a bunch of sFlow tools on it,
make sure the psample kernel module is loaded. In this first test I’ll take a look at
tablestakes. I compile VPP with the sFlow plugin, and enable that plugin in startup.conf on each
of the four VPP routers. For reference, the Lab looks like this:

What I’ll do is start an iperf3 server on vpp0-3 and then hit it from vpp0-0, to generate
a few TCP traffic streams back and forth, which will be traversing vpp0-2 and vpp0-1, like so:
pim@vpp0-3:~ $ iperf3 -s -D
pim@vpp0-0:~ $ iperf3 -c vpp0-3.lab.ipng.ch -t 86400 -P 10 -b 10M
Configuring VPP for sFlow
While this iperf3 is running, I’ll log on to vpp0-2 to take a closer look. The first thing I do,
is turn on packet sampling on vpp0-2’s interface that points at vpp0-3, which is Gi10/0/1, and
the interface that points at vpp0-0, which is Gi10/0/0. That’s easy enough, and I will use a
sampling rate of 1:1000 as these interfaces are GigabitEthernet:
root@vpp0-2:~# vppctl sflow enable-disable GigabitEthernet10/0/0 1000
root@vpp0-2:~# vppctl sflow enable-disable GigabitEthernet10/0/1 1000
root@vpp0-2:~# vppctl show run | egrep '(Name|sflow)'
       Name         State       Calls       Vectors  Suspends      Clocks     Vectors/Call
sflow              active        5656         24168         0      9.01e2     4.27
Nice! VPP inserted the sflow node between dpdk-input and ethernet-input where it can do its
business. But is it sending data? To answer this question, I can first take a look at the
psampletest tool:
root@vpp0-2:~# psampletest
pstest: modprobe psample returned 0
pstest: netlink socket number = 1637
pstest: getFamily
pstest: generic netlink CMD = 1
pstest: generic family name: psample
pstest: generic family id: 32
pstest: psample attr type: 4 (nested=0) len: 8
pstest: psample attr type: 5 (nested=0) len: 8
pstest: psample attr type: 6 (nested=0) len: 24
pstest: psample multicast group id: 9
pstest: psample multicast group: config
pstest: psample multicast group id: 10
pstest: psample multicast group: packets
pstest: psample found group packets=10
pstest: joinGroup 10
pstest: received Netlink ACK
pstest: joinGroup 10
pstest: set headers...
pstest: serialize...
pstest: print before sending...
pstest: psample netlink (type=32) CMD = 0
pstest: grp=1 in=7 out=9 n=1000 seq=1 pktlen=1514 hdrlen=31 pkt=0x558c08ba4958 q=3 depth=33333333 delay=123456
pstest: send...
pstest: send_psample getuid=0 geteuid=0
pstest: sendmsg returned 140
pstest: free...
pstest: start read loop...
pstest: psample netlink (type=32) CMD = 0
pstest: grp=1 in=1 out=0 n=1000 seq=600320 pktlen=2048 hdrlen=132 pkt=0x7ffe0e4776c8 q=0 depth=0 delay=0
pstest: psample netlink (type=32) CMD = 0
pstest: grp=1 in=1 out=0 n=1000 seq=600321 pktlen=2048 hdrlen=132 pkt=0x7ffe0e4776c8 q=0 depth=0 delay=0
pstest: psample netlink (type=32) CMD = 0
pstest: grp=1 in=1 out=0 n=1000 seq=600322 pktlen=2048 hdrlen=132 pkt=0x7ffe0e4776c8 q=0 depth=0 delay=0
pstest: psample netlink (type=32) CMD = 0
pstest: grp=1 in=2 out=0 n=1000 seq=600423 pktlen=66 hdrlen=70 pkt=0x7ffdb0d5a1e8 q=0 depth=0 delay=0
pstest: psample netlink (type=32) CMD = 0
pstest: grp=1 in=1 out=0 n=1000 seq=600324 pktlen=2048 hdrlen=132 pkt=0x7ffe0e4776c8 q=0 depth=0 delay=0
I am amazed! The psampletest output shows a few packets, considering I’m asking iperf3 to push
100Mbit using 9000 byte jumboframes (which would be something like 1400 packets/second), I can
expect two or three samples per second. I immediately notice a few things:
1. Network Namespace: The Netlink sampling channel belongs to a network namespace. The VPP
process is running in the default netns, so its PSAMPLE netlink messages will be in that namespace.
Thus, the psampletest and other tools must also run in that namespace. I mention this because in
Linux CP, often times the controlplane interfaces are created in a dedicated dataplane network
namespace.
2. pktlen and hdrlen: The pktlen is wrong, and this is a bug. In VPP, packets are put into
buffers of size 2048, and if there is a jumboframe, that means multiple buffers are concatenated for
the same packet. The packet length here ought to be 9000 in one direction. Looking at the in=2
packet with length 66, that looks like a legitimate ACK packet on the way back. But why is the
hdrlen set to 70 there? I’m going to want to ask Neil about that.
3. ingress and egress: The in=1 and one packet with in=2 represent the input hw_if_index
which is the ifIndex that VPP assigns to its devices. And looking at show interfaces, indeed
number 1 corresponds with GigabitEthernet10/0/0 and 2 is GigabitEthernet10/0/1, which checks
out:
root@vpp0-2:~# vppctl show int
              Name          Idx    State  MTU (L3/IP4/IP6/MPLS)     Counter          Count
GigabitEthernet10/0/0         1      up          9000/0/0/0     rx packets             469552764
                                                                rx bytes           4218754400233
                                                                tx packets             133717230
                                                                tx bytes              8887341013
                                                                drops                       6050
                                                                ip4                    469321635
                                                                ip6                       225164
GigabitEthernet10/0/1         2      up          9000/0/0/0     rx packets             133527636
                                                                rx bytes              8816920909
                                                                tx packets             469353481
                                                                tx bytes           4218736200819
                                                                drops                       6060
                                                                ip4                    133489925
                                                                ip6                        29139
4. ifIndexes are orthogonal: These in=1 or in=2 ifIndex numbers are constructs of the VPP
dataplane. Notably, VPP’s numbering of interface index is strictly orthogonal to Linux, and it’s
not guaranteed that there even exists an interface in Linux for the PHY upon which the sampling is
happening. Said differently, in=1 here is meant to reference VPP’s GigabitEthernet10/0/0
interface, but in Linux, ifIndex=1 is a completely different interface (lo) in the default
network namespace. Similarly in=2 for VPP’s Gi10/0/1 interface corresponds to interface enp1s0
in Linux:
root@vpp0-2:~# ip link
1: lo: <LOOPBACK,UP,LOWER_UP> mtu 65536 qdisc noqueue state UNKNOWN mode DEFAULT group default qlen 1000
    link/loopback 00:00:00:00:00:00 brd 00:00:00:00:00:00
2: enp1s0: <BROADCAST,MULTICAST,UP,LOWER_UP> mtu 9000 qdisc fq_codel state UP mode DEFAULT group default qlen 1000
    link/ether 52:54:00:f0:01:20 brd ff:ff:ff:ff:ff:ff
5. Counters: sFlow periodically polls the interface counters for all interfaces. It will
normally use /proc/net/ entries for that, but there are two problems with this:
-
There may not exist a Linux representation of the interface, for example if it’s only doing L2 bridging or cross connects in the VPP dataplane, and it does not have a Linux Control Plane interface, or
linux-cpis not used at all. -
Even if it does exist and it’s the “correct” ifIndex in Linux, for example if the Linux Interface Pair’s tuntap
host_vif_indexindex is used, even then the statistics counters in the Linux representation will only count packets and octets of punted packets, that is to say, the stuff that LinuxCP has decided need to go to the Linux kernel through the TUN/TAP device. Important to note that east-west traffic that goes through the dataplane, is never punted to Linux, and as such, the counters will be undershooting: only counting traffic to the router, not through the router.
VPP sFlow: Performance
Now that I’ve shown that Neil’s proof of concept works, I will take a better look at the performance of the plugin. I’ve made a mental note that the plugin sends RPCs from worker threads to the main thread to marshall the PSAMPLE messages out. I’d like to see how expensive that is, in general. So, I pull boot two Dell R730 machines in IPng’s Lab and put them to work. The first machine will run Cisco’s T-Rex loadtester with 8x 10Gbps ports (4x dual Intel 58299), while the second (identical) machine will run VPP also ith 8x 10Gbps ports (2x Intel i710-DA4).
I will test a bunch of things in parallel. First off, I’ll test L2 (xconnect) and L3 (IPv4 routing), and secondly I’ll test that with and without sFlow turned on. This gives me 8 ports to configure, and I’ll start with the L2 configuration, as follows:
vpp# set int state TenGigabitEthernet3/0/2 up
vpp# set int state TenGigabitEthernet3/0/3 up
vpp# set int state TenGigabitEthernet130/0/2 up
vpp# set int state TenGigabitEthernet130/0/3 up
vpp# set int l2 xconnect TenGigabitEthernet3/0/2 TenGigabitEthernet3/0/3
vpp# set int l2 xconnect TenGigabitEthernet3/0/3 TenGigabitEthernet3/0/2
vpp# set int l2 xconnect TenGigabitEthernet130/0/2 TenGigabitEthernet130/0/3
vpp# set int l2 xconnect TenGigabitEthernet130/0/3 TenGigabitEthernet130/0/2
Then, the L3 configuration looks like this:
vpp# lcp create TenGigabitEthernet3/0/0 host-if xe0-0
vpp# lcp create TenGigabitEthernet3/0/1 host-if xe0-1
vpp# lcp create TenGigabitEthernet130/0/0 host-if xe1-0
vpp# lcp create TenGigabitEthernet130/0/1 host-if xe1-1
vpp# set int state TenGigabitEthernet3/0/0 up
vpp# set int state TenGigabitEthernet3/0/1 up
vpp# set int state TenGigabitEthernet130/0/0 up
vpp# set int state TenGigabitEthernet130/0/1 up
vpp# set int ip address TenGigabitEthernet3/0/0 100.64.0.1/31
vpp# set int ip address TenGigabitEthernet3/0/1 100.64.1.1/31
vpp# set int ip address TenGigabitEthernet130/0/0 100.64.4.1/31
vpp# set int ip address TenGigabitEthernet130/0/1 100.64.5.1/31
vpp# ip route add 16.0.0.0/24 via 100.64.0.0
vpp# ip route add 48.0.0.0/24 via 100.64.1.0
vpp# ip route add 16.0.2.0/24 via 100.64.4.0
vpp# ip route add 48.0.2.0/24 via 100.64.5.0
vpp# ip neighbor TenGigabitEthernet3/0/0 100.64.0.0 00:1b:21:06:00:00 static
vpp# ip neighbor TenGigabitEthernet3/0/1 100.64.1.0 00:1b:21:06:00:01 static
vpp# ip neighbor TenGigabitEthernet130/0/0 100.64.4.0 00:1b:21:87:00:00 static
vpp# ip neighbor TenGigabitEthernet130/0/1 100.64.5.0 00:1b:21:87:00:01 static
And finally, the Cisco T-Rex configuration looks like this:
- version: 2
  interfaces: [ '06:00.0', '06:00.1', '83:00.0', '83:00.1', '87:00.0', '87:00.1', '85:00.0', '85:00.1' ]
  port_info:
    - src_mac:  00:1b:21:06:00:00
      dest_mac: 9c:69:b4:61:a1:dc
    - src_mac:  00:1b:21:06:00:01
      dest_mac: 9c:69:b4:61:a1:dd

    - src_mac:  00:1b:21:83:00:00
      dest_mac: 00:1b:21:83:00:01
    - src_mac:  00:1b:21:83:00:01
      dest_mac: 00:1b:21:83:00:00

    - src_mac:  00:1b:21:87:00:00
      dest_mac: 9c:69:b4:61:75:d0
    - src_mac:  00:1b:21:87:00:01
      dest_mac: 9c:69:b4:61:75:d1

    - src_mac:  9c:69:b4:85:00:00
      dest_mac: 9c:69:b4:85:00:01
    - src_mac:  9c:69:b4:85:00:01
      dest_mac: 9c:69:b4:85:00:00
A little note on the use of ip neighbor in VPP and specific dest_mac in T-Rex. In L2 mode,
because the VPP interfaces will be in promiscuous mode and simply pass through any ethernet frame
received on interface Te3/0/2 and copy it out on Te3/0/3 and vice-versa, there is no need to
tinker with MAC addresses. But in L3 mode, the NIC will only accept ethernet frames addressed to its
MAC address, so you can see that for the first port in T-Rex, I am setting dest_mac: 9c:69:b4:61:a1:dc which is the MAC address of Te3/0/0 on VPP. And then on the way out, if VPP
wants to send traffic back to T-Rex, I’ll give it a static ARP entry with ip neighbor .. static.
With that said, I can start a baseline loadtest like so:
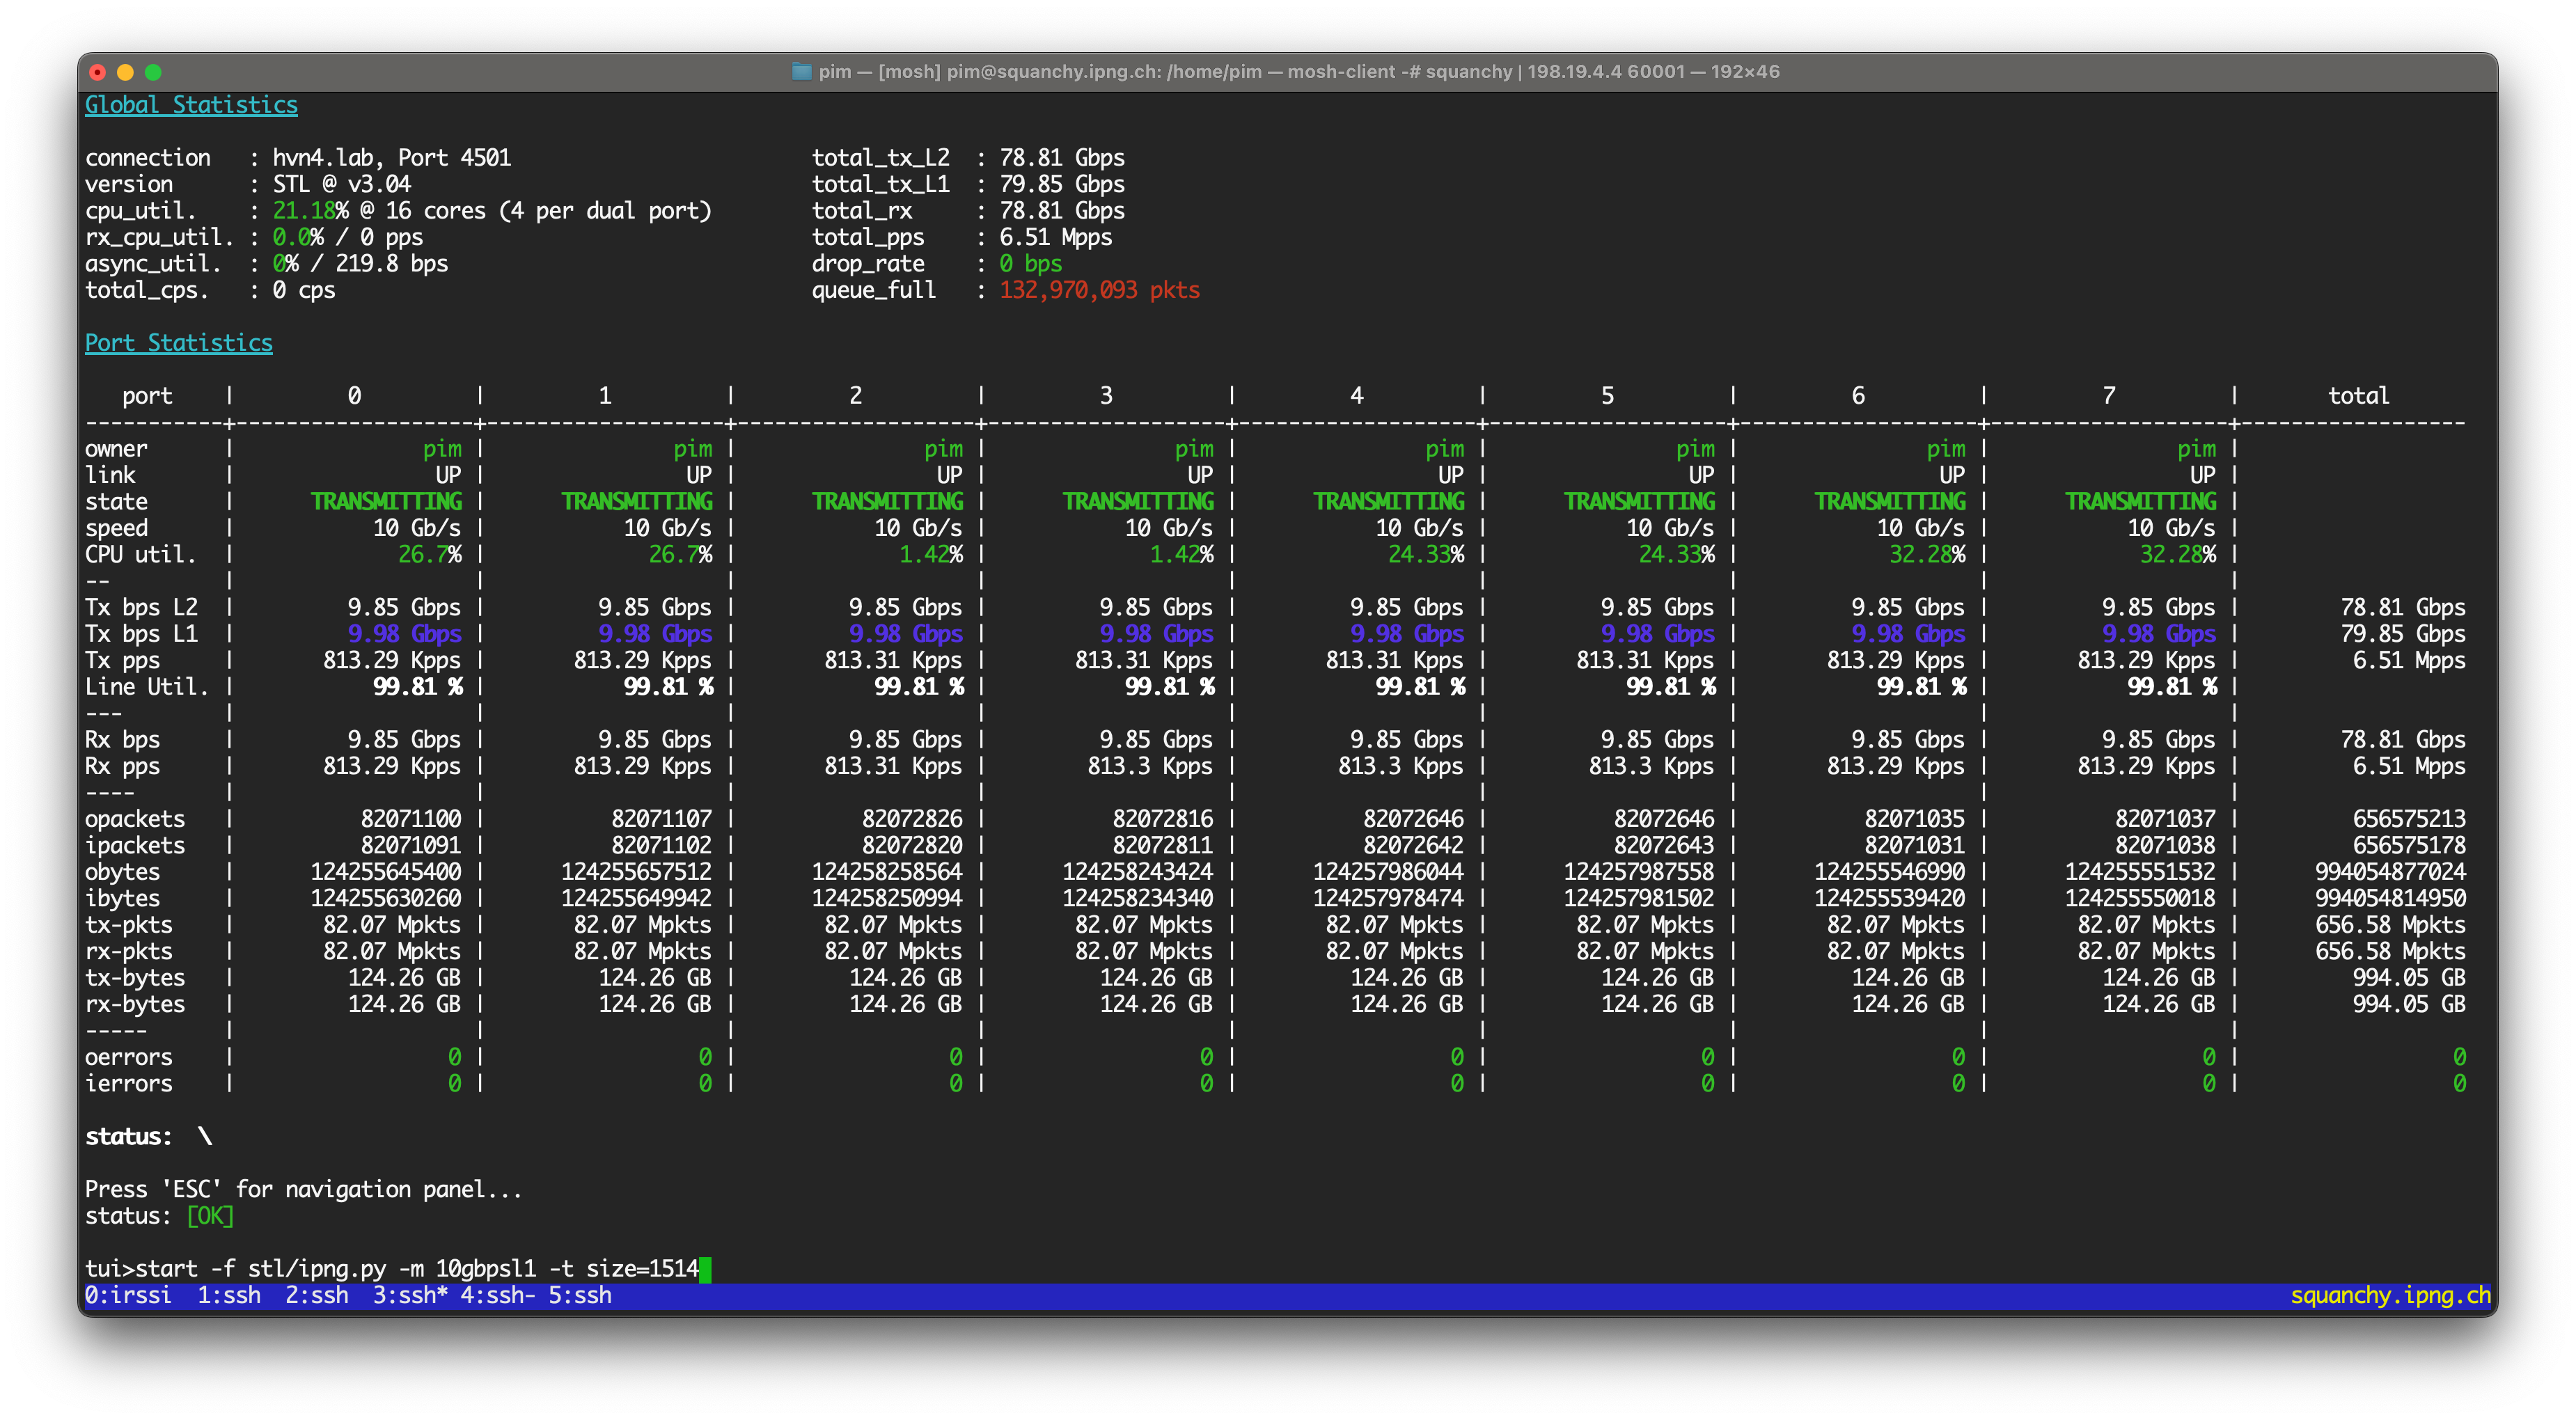
T-Rex is sending 10Gbps out on all eight interfaces (four of which are L3 routing, and four of which are L2 xconnecting), using packet size of 1514 bytes. This amounts of roughlu 813Kpps per port, or a cool 6.51Mpps in total. And I can see, in this base line configuration, the VPP router is happy to do the work.
I then enable sFlow on the second set of four ports, using a 1:1000 sampling rate:
pim@hvn6-lab:~$ vppctl sflow enable-disable TenGigabitEthernet130/0/0 1000
pim@hvn6-lab:~$ vppctl sflow enable-disable TenGigabitEthernet130/0/1 1000
pim@hvn6-lab:~$ vppctl sflow enable-disable TenGigabitEthernet130/0/2 1000
pim@hvn6-lab:~$ vppctl sflow enable-disable TenGigabitEthernet130/0/3 1000
This should yield about 3'250 or so samples per second, and things look pretty great:
pim@hvn6-lab:~$ vppctl show err
   Count                  Node                              Reason               Severity
   5034508               sflow                     sflow packets processed         error
      4908               sflow                      sflow packets sampled          error
   5034508               sflow                     sflow packets processed         error
      5111               sflow                      sflow packets sampled          error
   5034516             l2-output                      L2 output packets            error
   5034516              l2-input                       L2 input packets            error
   5034404               sflow                     sflow packets processed         error
      4948               sflow                      sflow packets sampled          error
   5034404             l2-output                      L2 output packets            error
   5034404              l2-input                       L2 input packets            error
   5034404               sflow                     sflow packets processed         error
      4928               sflow                      sflow packets sampled          error
   5034404             l2-output                      L2 output packets            error
   5034404              l2-input                       L2 input packets            error
   5034516             l2-output                      L2 output packets            error
   5034516              l2-input                       L2 input packets            error
I can see that the sflow packets sampled is roughly 0.1% of the sflow packets processed which
checks out. I can also see in psampletest a flurry of activity, so I’m happy:
pim@hvn6-lab:~$ sudo psampletest
...
pstest: grp=1 in=9 out=0 n=1000 seq=63388 pktlen=1510 hdrlen=132 pkt=0x7ffd9e786158 q=0 depth=0 delay=0
pstest: psample netlink (type=32) CMD = 0
pstest: grp=1 in=8 out=0 n=1000 seq=63389 pktlen=1510 hdrlen=132 pkt=0x7ffd9e786158 q=0 depth=0 delay=0
pstest: psample netlink (type=32) CMD = 0
pstest: grp=1 in=11 out=0 n=1000 seq=63390 pktlen=1510 hdrlen=132 pkt=0x7ffd9e786158 q=0 depth=0 delay=0
pstest: psample netlink (type=32) CMD = 0
pstest: grp=1 in=10 out=0 n=1000 seq=63391 pktlen=1510 hdrlen=132 pkt=0x7ffd9e786158 q=0 depth=0 delay=0
pstest: psample netlink (type=32) CMD = 0
pstest: grp=1 in=11 out=0 n=1000 seq=63392 pktlen=1510 hdrlen=132 pkt=0x7ffd9e786158 q=0 depth=0 delay=0
I confirm that all four in interfaced (8, 9, 10 and 11) are sending samples, and those indexes
correctly correspond to the VPP dataplane’s sw_if_index for TenGig130/0/0 - 3. Sweet! On this
machine, each TenGig network interface has its own dedicated VPP worker thread. Considering I
turned on sFlow sampling on four interfaces, I should see the cost I’m paying for the feature:
pim@hvn6-lab:~$ vppctl show run | grep -e '(Name|sflow)'
Name                 State         Calls       Vectors Suspends      Clocks     Vectors/Call
sflow               active       3908218      14350684        0      9.05e1     3.67
sflow               active       3913266      14350680        0      1.11e2     3.67
sflow               active       3910828      14350687        0      1.08e2     3.67
sflow               active       3909274      14350692        0      5.66e1     3.67
Alright, so for the 999 packets that went through and the one packet that got sampled, on average VPP is spending between 90 and 111 CPU cycles per packet, and the loadtest looks squeaky clean on T-Rex.
VPP sFlow: Cost of passthru
I decide to take a look at two edge cases. What if there are no samples being taken at all, and the
sflow node is merely passing through all packets to ethernet-input? To simulate this, I will set
up a bizarrely high sampling rate, say one in ten million. I’ll also make the T-Rex loadtester use
only four ports, in other words, a unidirectional loadtest, and I’ll make it go much faster by
sending smaller packets, say 128 bytes:
tui>start -f stl/ipng.py -p 0 2 4 6 -m 99% -t size=128

pim@hvn6-lab:~$ vppctl sflow enable-disable TenGigabitEthernet130/0/0 1000 disable
pim@hvn6-lab:~$ vppctl sflow enable-disable TenGigabitEthernet130/0/1 1000 disable
pim@hvn6-lab:~$ vppctl sflow enable-disable TenGigabitEthernet130/0/2 1000 disable
pim@hvn6-lab:~$ vppctl sflow enable-disable TenGigabitEthernet130/0/3 1000 disable

pim@hvn6-lab:~$ vppctl sflow enable-disable TenGigabitEthernet130/0/0 10000000
pim@hvn6-lab:~$ vppctl sflow enable-disable TenGigabitEthernet130/0/2 10000000
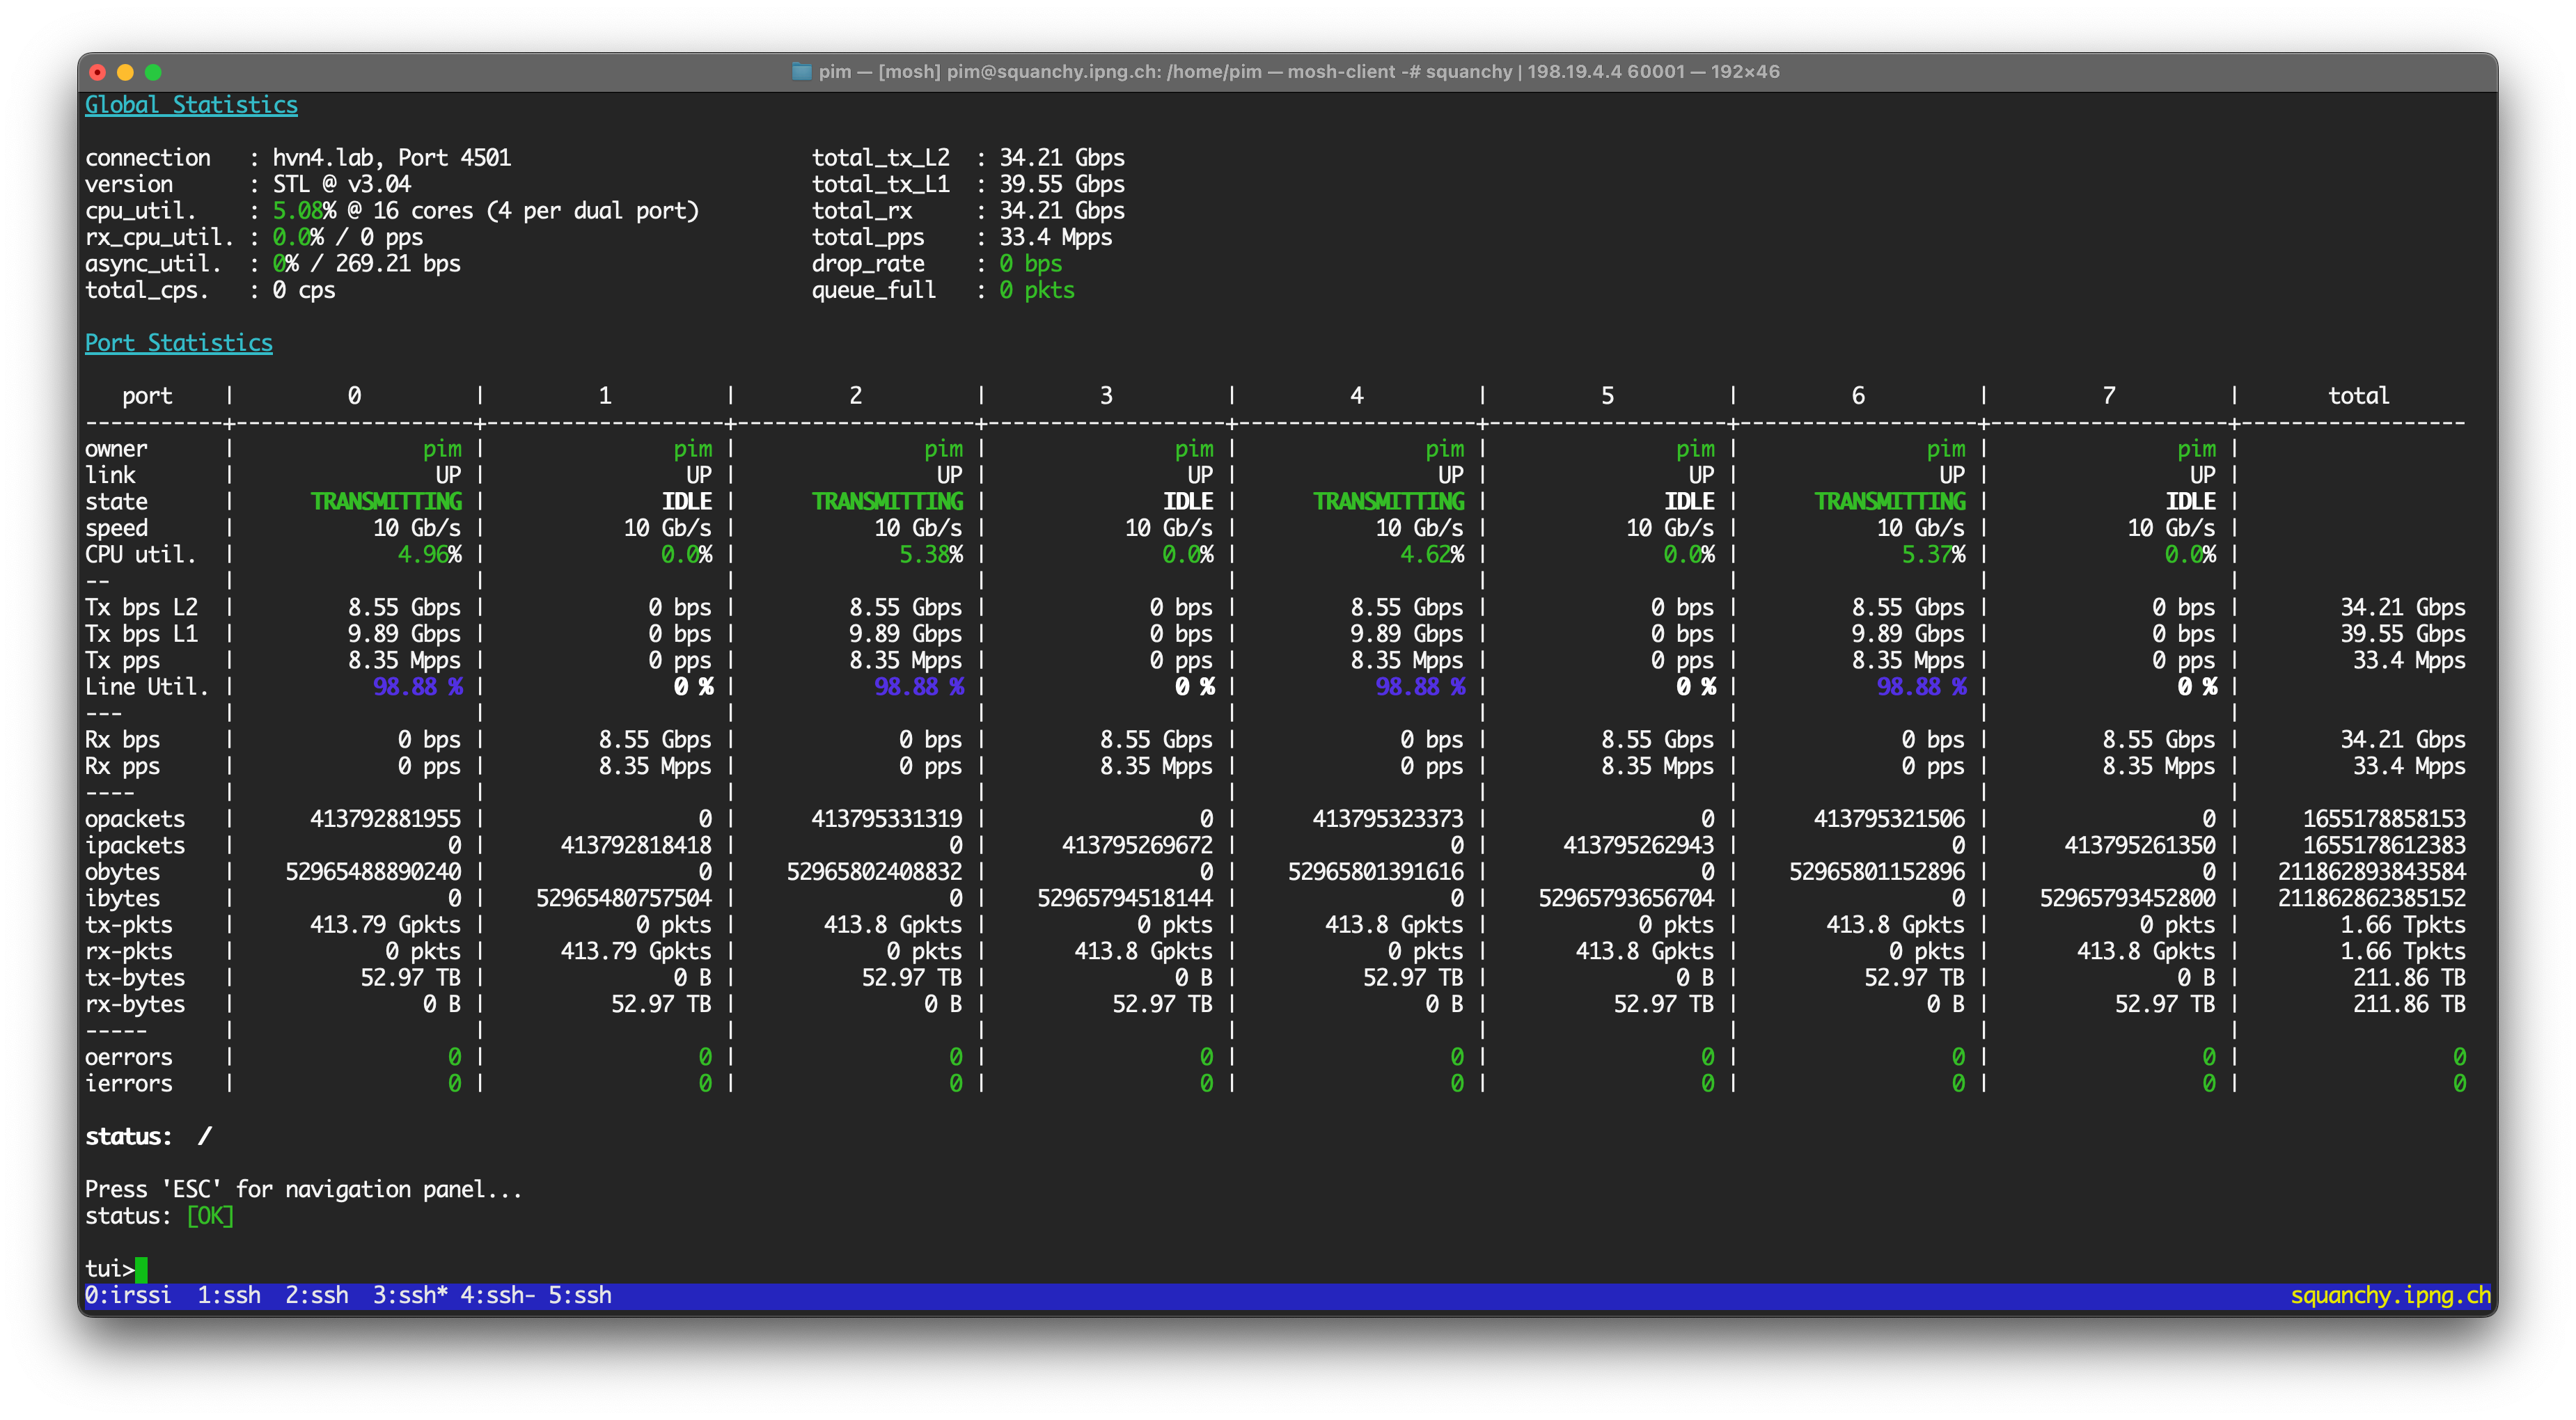
The loadtester is now sending 33.5Mpps or thereabouts (4x 8.37Mpps), and I can confirm that the
sFlow plugin is not sampling many packets:
pim@hvn6-lab:~$ vppctl show err
   Count                  Node                              Reason               Severity
  59777084               sflow                     sflow packets processed         error
         6               sflow                      sflow packets sampled          error
  59777152             l2-output                      L2 output packets            error
  59777152              l2-input                       L2 input packets            error
  59777104               sflow                     sflow packets processed         error
         6               sflow                      sflow packets sampled          error
  59777104             l2-output                      L2 output packets            error
  59777104              l2-input                       L2 input packets            error

pim@hvn6-lab:~$ vppctl show run | grep -e '(Name|sflow)'
Name                 State         Calls       Vectors Suspends      Clocks     Vectors/Call
sflow                active      8186642     369674664        0      1.35e1     45.16
sflow                active     25173660     369674696        0      1.97e1     14.68
Two observations:
-
One of these is busier than the other. Without looking further, I can already predict that the top one (doing 45.16 vectors/call) is the L3 thread. Reasoning: the L3 code path through the dataplane is a lot more expensive than ‘merely’ L2 XConnect. As such, the packets will spend more time, and therefore the iterations of the
dpdk-inputloop will be further apart in time. And because of that, it’ll end up consuming more packets on each subsequent iteration, in order to catch up. The L2 path on the other hand, is quicker and therefore will have less packets waiting on subsequent iterations ofdpdk-input. -
The
sflowplugin spends between 13.5 and 19.7 CPU cycles shoveling the packets intoethernet-inputwithout doing anything to them. That’s pretty low! And the L3 path is a little bit more efficient per packet, which is very likely because it gets to amort its L1/L2 CPU instruction cache over 45 packets each time it runs, while the L2 path can only amort its instruction cache over 15 or so packets each time it runs.
I let the loadtest run overnight,and the proof is in the pudding: sFlow enabled but not sampling works just fine:
VPP sFlow: Cost of sampling
The other interesting case is to figure out how much CPU it takes to execute the code path with the actual sampling. This one turns out a bit trickier to measure. While leaving the previous loadtest running at 33.5Mpps, I disable sFlow and then re-enable it at an abnormally high ratio of 1:10 packets:
pim@hvn6-lab:~$ vppctl sflow enable-disable TenGigabitEthernet130/0/0 disable
pim@hvn6-lab:~$ vppctl sflow enable-disable TenGigabitEthernet130/0/2 disable
pim@hvn6-lab:~$ vppctl sflow enable-disable TenGigabitEthernet130/0/0 10
pim@hvn6-lab:~$ vppctl sflow enable-disable TenGigabitEthernet130/0/2 10
The T-Rex view immediately reveals that VPP is not doing very well, as the throughput went from 33.5Mpps all the way down to 7.5Mpps. Ouch! Looking at the dataplane:
pim@hvn6-lab:~$ vppctl show err | grep sflow
 340502528               sflow                     sflow packets processed         error
  12254462               sflow                      sflow packets dropped          error
  22611461               sflow                      sflow packets sampled          error
 422527140               sflow                     sflow packets processed         error
   8533855               sflow                      sflow packets dropped          error
  34235952               sflow                      sflow packets sampled          error
Ha, this new safeguard popped up: remember all the way at the beginning, I explained how there’s a
safety net in the sflow plugin that will pre-emptively drop the sample if the RPC channel towards
the main thread is seeing too many outstanding RPCs? That’s happening right now, under the moniker
sflow packets dropped, and it’s roughly half of the samples.
My first attempt is to back off the loadtester to roughly 1.5Mpps per port (so 6Mpps in total, under the current limit of 7.5Mpps), but I’m disappointed: the VPP instance is now returning 665Kpps per port only, which is horrible, and it’s still dropping samples.
My second attempt is to turn off all ports but last pair (the L2XC port), which returns 930Kpps from the offered 1.5Mpps. VPP is clearly not having a good time here.
Finally, as a validation, I turn off all ports but the first pair (the L3 port, without sFlow), and ramp up the traffic to 8Mpps. Success (unsurprising to me). I also ramp up the second pair (the L2XC port, without sFlow), VPP forwards all 16Mpps and is happy again.
Once I turn on the third pair (the L3 port, with sFlow), even at 1Mpps, the whole situation regresses again: First two ports go down from 8Mpps to 5.2Mpps each; the third (offending) port delivers 740Kpps out of 1Mpps. Clearly, there’s some work to do under high load situations!
Reasoning about the bottle neck
But how expensive is sending samples, really? To try to get at least some pseudo-scientific answer I turn off all ports again, and ramp up the one port pair with (L3 + sFlow at 1:10 ratio) to full line rate: that is 64 byte packets at 14.88Mpps:
tui>stop
tui>start -f stl/ipng.py -m 100% -p 4 -t size=64
VPP is now on the struggle bus and is returning 3.16Mpps or 21% of that. But, I think it’ll give me some reasonable data to try to feel out where the bottleneck is.
Thread 2 vpp_wk_1 (lcore 3)
Time 6.3, 10 sec internal node vector rate 256.00 loops/sec 27310.73
  vector rates in 3.1607e6, out 3.1607e6, drop 0.0000e0, punt 0.0000e0
             Name                 State     Calls    Vectors   Suspends   Clocks   Vectors/Call
TenGigabitEthernet130/0/1-outp   active     77906   19943936          0   5.79e0         256.00
TenGigabitEthernet130/0/1-tx     active     77906   19943936          0   6.88e1         256.00
dpdk-input                       polling    77906   19943936          0   4.41e1         256.00
ethernet-input                   active     77906   19943936          0   2.21e1         256.00
ip4-input                        active     77906   19943936          0   2.05e1         256.00
ip4-load-balance                 active     77906   19943936          0   1.07e1         256.00
ip4-lookup                       active     77906   19943936          0   1.98e1         256.00
ip4-rewrite                      active     77906   19943936          0   1.97e1         256.00
sflow                            active     77906   19943936          0   6.14e1         256.00

pim@hvn6-lab:pim# vppctl show err | grep sflow
 551357440               sflow                     sflow packets processed         error
  19829380               sflow                      sflow packets dropped          error
  36613544               sflow                      sflow packets sampled          error
OK, the sflow plugin saw 551M packets, selected 36.6M of them for sampling, but ultimately only
sent RPCs to the main thread for 16.8M samples after having dropped 19.8M of them. There are three
code paths, each one extending the other:
- Super cheap: pass through. I already learned that it takes about X=13.5 CPU cycles to pass through a packet.
- Very cheap: select sample and construct the RPC, but toss it, costing Y CPU cycles.
- Expensive: select sample, and send the RPC. Z CPU cycles in worker, and another amount in main.
Now I don’t know what Y is, but seeing as the selection only copies some data from the VPP buffer
into a new sflow_sample_t, and it uses clip_memcpy_fast() for the sample header, I’m going to
assume it’s not drastically more expensive than the super cheap case, so for simplicity I’ll
guesstimate that it takes Y=20 CPU cyces.
With that guess out of the way, I can see what the sflow plugin is consuming for the third case:
AvgClocks = (Total * X + Sampled * Y + RPCSent * Z) / Total

61.4 = ( 551357440 * 13.5 + 36613544 * 20 + (36613544-19829380) * Z ) / 551357440
61.4 = ( 7443325440 + 732270880 + 16784164 * Z ) / 551357440
33853346816 = 7443325440 + 732270880 + 16784164 * Z
25677750496 = 16784164 * Z
Z = 1529
Good to know! I find spending O(1500) cycles to send the sample pretty reasonable. However, for a dataplane that is trying to do 10Mpps per core, and a core running 2.2GHz, there are really only 220 CPU cycles to spend end-to-end. Spending an order of magnitude more than that once every ten packets feels dangerous to me.
Here’s where I start my conjecture. If I count the CPU cycles spent in the table above, I will see
273 CPU cycles spent on average per packet. The CPU in the VPP router is an E5-2696 v4 @ 2.20GHz,
which means it should be able to do 2.2e10/273 = 8.06Mpps per thread, more than double that what I
observe (3.16Mpps)! But, for all the vector rates in (3.1607e6), it also managed to emit the
packets back out (same number: 3.1607e6).
So why isn’t VPP getting more packets from DPDK? I poke around a bit and find an important clue:
pim@hvn6-lab:~$ vppctl show hard TenGigabitEthernet130/0/0 | grep rx\ missed; \
                sleep 10; vppctl show hard TenGigabitEthernet130/0/0 | grep rx\ missed
    rx missed                                     4065539464
    rx missed                                     4182788310
In those ten seconds, VPP missed (4182788310-4065539464)/10 = 11.72Mpps. I already measured that it
forwarded 3.16Mpps and you know what? 11.7 + 3.16 is precisely 14.88Mpps. All packets are accounted
for! It’s just, DPDK never managed to read them from the hardware: sad-trombone.wav
As a validation, I turned off sFlow while keeping that one port at 14.88Mpps. Now, 10.8Mpps were delivered:
Thread 2 vpp_wk_1 (lcore 3)
Time 14.7, 10 sec internal node vector rate 256.00 loops/sec 40622.64
  vector rates in 1.0794e7, out 1.0794e7, drop 0.0000e0, punt 0.0000e0
             Name                 State     Calls    Vectors   Suspends   Clocks   Vectors/Call
TenGigabitEthernet130/0/1-outp   active    620012  158723072          0   5.66e0         256.00
TenGigabitEthernet130/0/1-tx     active    620012  158723072          0   7.01e1         256.00
dpdk-input                       polling   620012  158723072          0   4.39e1         256.00
ethernet-input                   active    620012  158723072          0   1.56e1         256.00
ip4-input-no-checksum            active    620012  158723072          0   1.43e1         256.00
ip4-load-balance                 active    620012  158723072          0   1.11e1         256.00
ip4-lookup                       active    620012  158723072          0   2.00e1         256.00
ip4-rewrite                      active    620012  158723072          0   2.02e1         256.00
Total Clocks: 201 per packet; 2.2GHz/201 = 10.9Mpps, and I am observing 10.8Mpps. As [North of the Border] would say: “That’s not just good, it’s good enough!”
For completeness, I turned on all eight ports again, at line rate (8x14.88 = 119Mpps 🥰), and saw that about 29Mpps of that made it through. Interestingly, what was 3.16Mpps in the single-port line rate loadtest, went up slighty to 3.44Mpps now. What puzzles me even more, is that the non-sFlow worker threads are also impacted. I spent some time thinking about this and poking around, but I did not find a good explanation why port pair 0 (L3, no sFlow) and 1 (L2XC, no sFlow) would be impacted. Here’s a screenshot of VPP on the struggle bus:
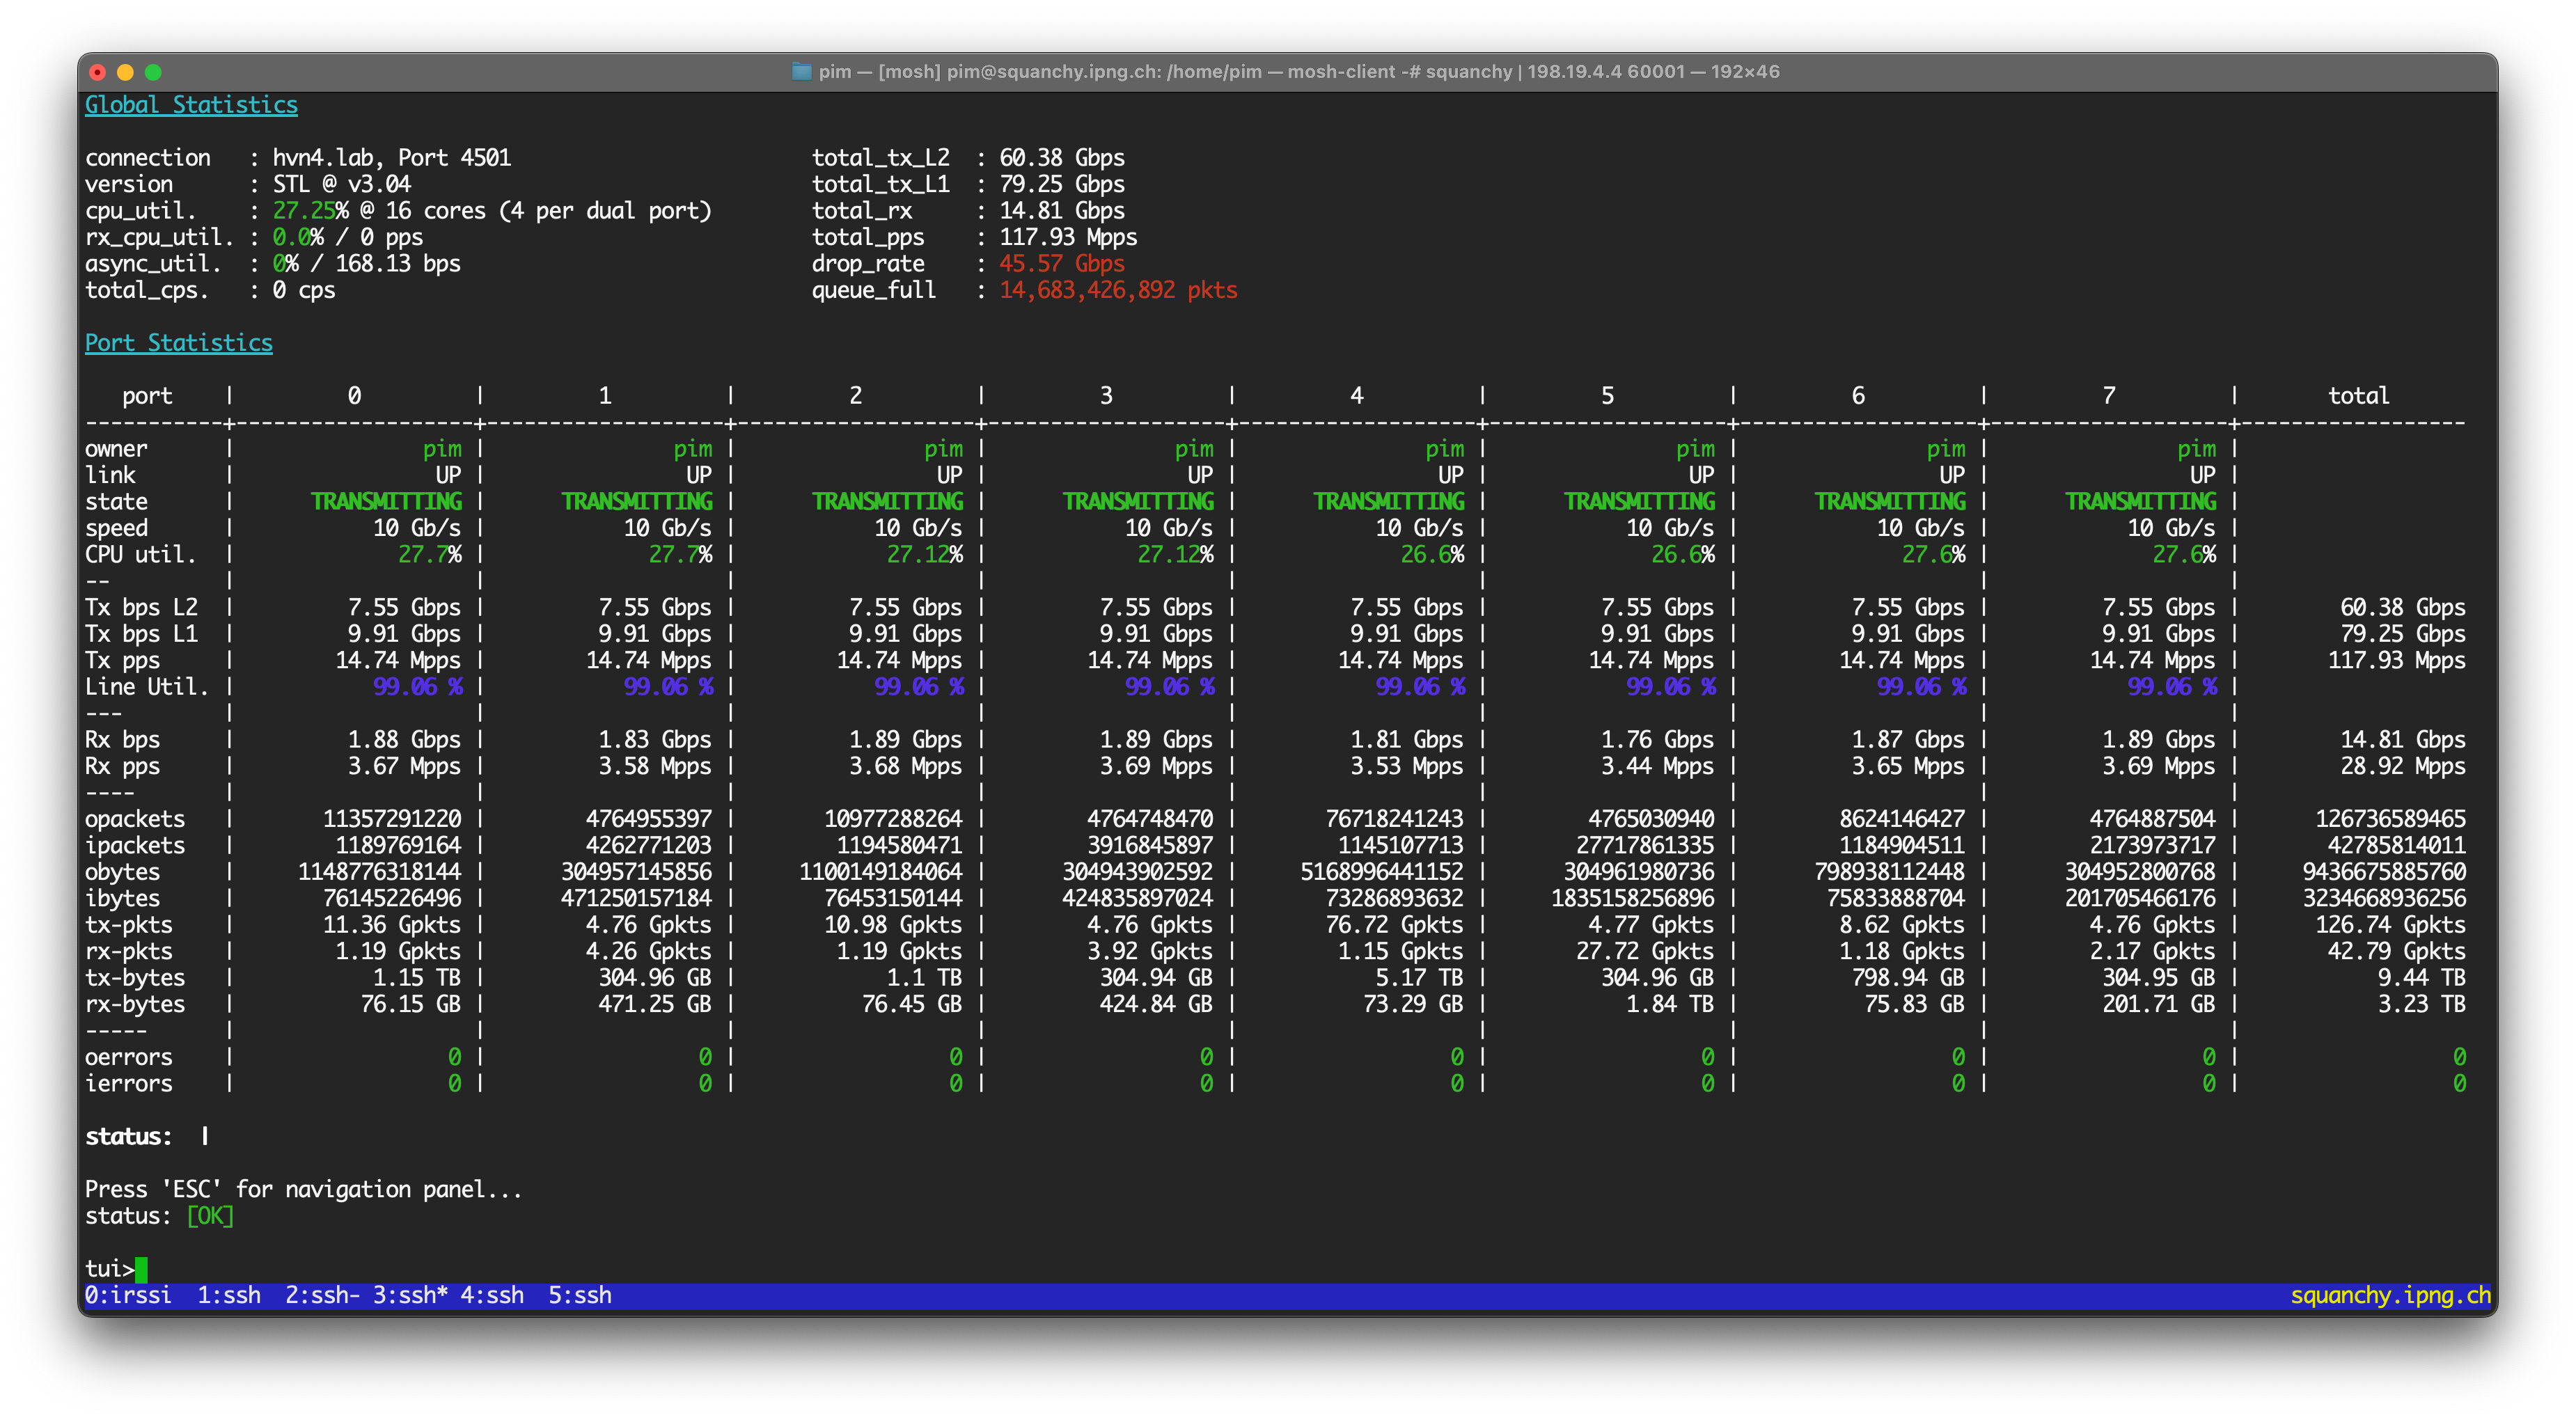
Hypothesis: Due to the spinlock in vl_api_rpc_call_main_thread(), the worker CPU is pegged
for a longer time, during which the dpdk-input PMD can’t run, so it misses out on these sweet
sweet packets that the network card had dutifully received for it, resulting in the rx-miss
situation. While VPP’s performance measurement shows 273 CPU cycles per packet and 3.16Mpps, this
accounts only for 862M cycles, while the thread has 2200M cycles, leaving a whopping 60% of CPU
cycles unused in the dataplane. I still don’t understand why other worker threads are impacted,
though.
What’s Next
I’ll continue to work with the folks in the sFlow and VPP communities and iterate on the plugin and
other sFlow Agent machinery. In an upcoming article, I hope to share more details on how to tie
the VPP plugin in to the hsflowd host sflow daemon in a way that the interface indexes, counters
and packet lengths are all correct. Of course, the main improvement that we can make is to allow for
the system to work better under load, which will take some thinking.
I should do a few more tests with a debug binary and profiling turned on. I quickly ran a perf
over the VPP (release / optimized) binary running on the bench, but it merely said 80% of time was
spent in libvlib rather than libvnet in the baseline (sFlow turned off).
root@hvn6-lab:/home/pim# perf record -p 1752441 sleep 10
root@hvn6-lab:/home/pim# perf report --stdio --sort=dso
# Overhead  Shared Object (sFlow)   Overhead  Shared Object (baseline)
# ........  ......................  ........  ........................
#
    79.02%  libvlib.so.24.10          54.27%  libvlib.so.24.10
    12.82%  libvnet.so.24.10          33.91%  libvnet.so.24.10
     3.77%  dpdk_plugin.so            10.87%  dpdk_plugin.so
     3.21%  [kernel.kallsyms]          0.81%  [kernel.kallsyms]
     0.29%  sflow_plugin.so            0.09%  ld-linux-x86-64.so.2
     0.28%  libvppinfra.so.24.10       0.03%  libc.so.6
     0.21%  libc.so.6                  0.01%  libvppinfra.so.24.10
     0.17%  libvlibapi.so.24.10        0.00%  libvlibmemory.so.24.10
     0.15%  libvlibmemory.so.24.10
     0.07%  ld-linux-x86-64.so.2
     0.00%  vpp
     0.00%  [vdso]
     0.00%  libsvm.so.24.10
Unfortunately, I’m not much of a profiler expert, being merely a network engineer :) so I may have
to ask for help. Of course, if you’re reading this, you may also offer help! There’s lots of
interesting work to do on this sflow plugin, with matching ifIndex for consumers like hsflowd,
reading interface counters from the dataplane (or from the Prometheus Exporter), and most
importantly, ensuring it works well, or fails gracefully, under stringent load.
From the cray-cray ideas department, what if we:
-
In worker thread, produced the sample but instead of sending an RPC to main and taking the lock, append it to a producer sample queue and move on. This way, no locks are needed, and each worker thread will have its own producer queue.
-
Create a separate worker (or even pool of workers), running on possibly a different CPU (or in main), that runs a loop iterating on all sflow sample queues consuming the samples and sending them in batches to the PSAMPLE Netlink group, possibly dropping samples if there are too many coming in.
I’m reminded that this pattern exists already – async crypto workers create a crypto-dispatch
node that acts as poller for inbound crypto, and it hands off the result back into the worker
thread: lockless at the expense of some complexity!
Acknowledgements
The plugin I am testing here is a prototype written by Neil McKee of inMon. I also wanted to say thanks to Pavel Odintsov of FastNetMon and Ciprian Balaceanu for showing an interest in this plugin, and Peter Phaal for facilitating a get-together last year.
Who’s up for making this thing a reality?!