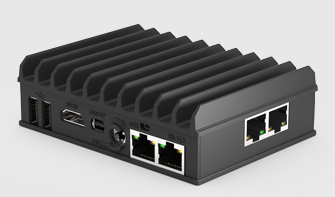
A while ago, in June 2021, we were discussing home routers that can keep up with 1G+ internet connections in the CommunityRack telegram channel. Of course at IPng Networks we are fond of the Supermicro Xeon D1518 [ref], which has a bunch of 10Gbit X522 and 1Gbit i350 and i210 intel NICs, but it does come at a certain price.
For smaller applications, PC Engines APU6 [ref] is kind of cool and definitely more affordable. But, in this chat, Patrick offered an alternative, the [Fitlet2] which is a small, passively cooled, and expandable IoT-esque machine.
Fast forward 18 months, and Patrick decided to sell off his units, so I bought one off of him, and decided to loadtest it. Considering the pricetag (the unit I will be testing will ship for around $400), and has the ability to use (1G/SFP) fiber optics, it may be a pretty cool one!
Executive Summary
TL/DR: Definitely a cool VPP router, 3x 1Gbit line rate, A- would buy again
With some care on the VPP configuration (notably RX/TX descriptors), this unit can handle L2XC at (almost) line rate in both directions (2.94Mpps out a theoretical 2.97Mpps), with one VPP worker thread, which it not just good, it’s Good Enough™, at which time there is still plenty of headroom on the CPU, as the Atom E3950 has 4 cores.
In IPv4 routing, using two VPP worker threads, and 2 RX/TX queues on each NIC, the machine keeps up with 64 byte traffic in both directions (ie 2.97Mpps), again with compute power to spare, and while using only two out of four CPU cores on the Atom E3950.
For a $400,- machine that draws close to 11 Watts fully loaded, and sporting 8GB (at a max of 16GB) this Fitlet2 is a gem: it will easily keep up 3x 1Gbit in a production environment, while carrying multiple full BGP tables (900K IPv4 and 170K IPv6), with room to spare. It’s a classy little machine!
Detailed findings
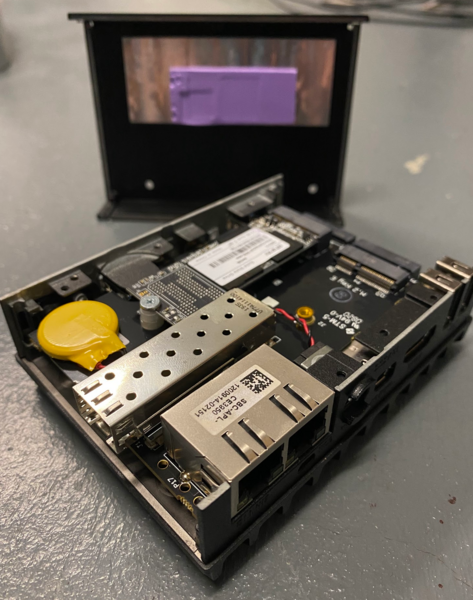
The first thing that I noticed when it arrived is how small it is! The design of the Fitlet2 has a motherboard with a non-removable Atom E3950 CPU running at 1.6GHz, from the Goldmont series. This is a notoriously slow/budget CPU, and it comes with 4C/4T, each CPU thread comes with 24kB of L1 and 1MB of L2 cache, and there is no L3 cache on this CPU at all. That would mean performance in applications like VPP (which try to leverage these caches) will be poorer – the main question on my mind is: does the CPU have enough oompff to keep up with the 1G network cards? I’ll want this CPU to be able to handle roughly 4.5Mpps in total, in order for Fitlet2 to count itself amongst the wirespeed routers.
Looking further, Fitlet2 has one HDMI and one MiniDP port, two USB2 and two USB3 ports, two Intel i211 NICs with RJ45 port (these are 1Gbit). There’s a helpful MicroSD slot, two LEDs and an audio in- and output 3.5mm jack. The power button does worry me a little bit, I feel like just brushing against it may turn the machine off. I do appreciate the cooling situation - the top finned plate mates with the CPU on the top of the motherboard, and the bottom bracket holds a sizable aluminium cooling block which further helps dissipate heat, without needing any active cooling. The Fitlet folks claim this machine can run in environments anywhere between -50C and +112C, which I won’t be doing :)
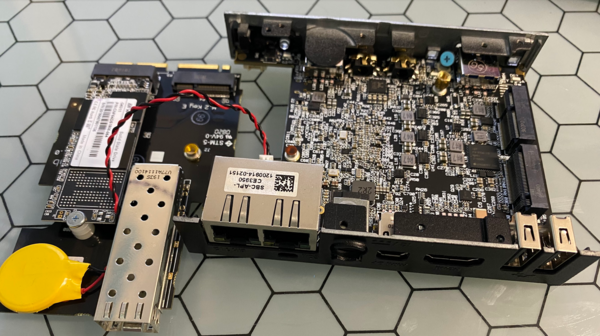
Inside, there’s a single DDR3 SODIMM slot for memory (the one I have came with 8GB at 1600MT/s) and a custom, ableit open specification expansion board called a FACET-Card which stands for Function And Connectivity Extension T-Card, well okay then! The FACET card in this little machine sports one extra Intel i210-IS NIC, an M2 for an SSD, and an M2E for a WiFi port. The NIC is a 1Gbit SFP capable device. You can see its optic cage on the FACET card above, next to the yellow CMOS / Clock battery.
The whole thing is fed with 12V powerbrick delivering 2A, and a nice touch is that the barrel connector has a plastic bracket that locks it into the chassis by turning it 90degrees, so it won’t flap around in the breeze and detach. I wish other embedded PCs would ship with those, as I’ve been fumbling around in 19" racks that are, let me say, less tightly cable organized, and may or may not have disconnected the CHIX routeserver at some point in the past. Sorry, Max :)
For the curious, here’s a list of interesting details: [lspci] - [dmidecode] - [likwid-topology] - [dmesg].
Preparing the Fitlet2
First, I grab a USB key and install Debian Bullseye (11.5) on it, using the UEFI installer. After
booting, I carry through the instructions on my [VPP Production]
post. Notably, I create the dataplane namespace, run an SSH and SNMP agent there, run
isolcpus=1-3 so that I can give three worker threads to VPP, but I start off giving it only one (1)
worker thread, because this way I can take a look at what the performance is of a single CPU, before
scaling out to the three (3) threads that this CPU can offer. I also take the defaults for DPDK,
notably allowing the DPDK poll-mode-drivers to take their proposed defaults:
- GigabitEthernet1/0/0: Intel Corporation I211 Gigabit Network Connection (rev 03)
rx: queues 1 (max 2), desc 512 (min 32 max 4096 align 8) tx: queues 2 (max 2), desc 512 (min 32 max 4096 align 8)
- GigabitEthernet3/0/0: Intel Corporation I210 Gigabit Fiber Network Connection (rev 03)
rx: queues 1 (max 4), desc 512 (min 32 max 4096 align 8) tx: queues 2 (max 4), desc 512 (min 32 max 4096 align 8)
I observe that the i211 NIC allows for a maximum of two (2) RX/TX queues, while the (older!) i210
will allow for four (4) of them. And another thing that I see here is that there are two (2) TX
queues active, but I only have one worker thread, so what gives? This is because there is always a
main thread and a worker thread, and it could be that the main thread needs to / wants to send
traffic out on an interface, so it always attaches to a queue in addition to the worker thread(s).
When exploring new hardware, I find it useful to take a look at the output of a few tactical show
commands on the CLI, such as:
1. What CPU is in this machine?
vpp# show cpu
Model name:               Intel(R) Atom(TM) Processor E3950 @ 1.60GHz
Microarch model (family): [0x6] Goldmont ([0x5c] Apollo Lake) stepping 0x9
Flags:                    sse3 pclmulqdq ssse3 sse41 sse42 rdrand pqe rdseed aes sha invariant_tsc
Base frequency:           1.59 GHz
2. Which devices on the PCI bus, PCIe speed details, and driver?
vpp# show pci
Address      Sock VID:PID     Link Speed    Driver          Product Name   Vital Product Data
0000:01:00.0   0  8086:1539   2.5 GT/s x1   uio_pci_generic
0000:02:00.0   0  8086:1539   2.5 GT/s x1   igb
0000:03:00.0   0  8086:1536   2.5 GT/s x1   uio_pci_generic
Note: This device at slot 02:00.0 is the second onboard RJ45 i211 NIC. I have used this one
to log in to the Fitlet2 and more easily kill/restart VPP and so on, but I could of course just as
well give it to VPP, in which case I’d have three gigabit interfaces to play with!
3. What details are known for the physical NICs?
vpp# show hardware GigabitEthernet1/0/0
GigabitEthernet1/0/0               1     up   GigabitEthernet1/0/0
  Link speed: 1 Gbps
  RX Queues:
    queue thread         mode
    0     vpp_wk_0 (1)   polling
  TX Queues:
    TX Hash: [name: hash-eth-l34 priority: 50 description: Hash ethernet L34 headers]
    queue shared thread(s)
    0     no     0
    1     no     1
  Ethernet address 00:01:c0:2a:eb:a8
  Intel e1000
    carrier up full duplex max-frame-size 2048
    flags: admin-up maybe-multiseg tx-offload intel-phdr-cksum rx-ip4-cksum int-supported
    rx: queues 1 (max 2), desc 512 (min 32 max 4096 align 8)
    tx: queues 2 (max 2), desc 512 (min 32 max 4096 align 8)
    pci: device 8086:1539 subsystem 8086:0000 address 0000:01:00.00 numa 0
    max rx packet len: 16383
    promiscuous: unicast off all-multicast on
    vlan offload: strip off filter off qinq off
    rx offload avail:  vlan-strip ipv4-cksum udp-cksum tcp-cksum vlan-filter
                       vlan-extend scatter keep-crc rss-hash
    rx offload active: ipv4-cksum scatter
    tx offload avail:  vlan-insert ipv4-cksum udp-cksum tcp-cksum sctp-cksum
                       tcp-tso multi-segs
    tx offload active: ipv4-cksum udp-cksum tcp-cksum multi-segs
    rss avail:         ipv4-tcp ipv4-udp ipv4 ipv6-tcp-ex ipv6-udp-ex ipv6-tcp
                       ipv6-udp ipv6-ex ipv6
    rss active:        none
    tx burst function: (not available)
    rx burst function: (not available)
Configuring VPP
After this exploratory exercise, I have learned enough about the hardware to be able to take the Fitlet2 out for a spin. To configure the VPP instance, I turn to [vppcfg], which can take a YAML configuration file describing the desired VPP configuration, and apply it safely to the running dataplane using the VPP API. I’ve written a few more posts on how it does that, notably on its [syntax] and its [planner]. A complete configuration guide on vppcfg can be found [here].
pim@fitlet:~$ sudo dpkg -i {lib,}vpp*23.06*deb
pim@fitlet:~$ sudo apt install python3-pip
pim@fitlet:~$ sudo pip install vppcfg-0.0.3-py3-none-any.whl
Methodology
Method 1: Single CPU Thread Saturation
First I will take VPP out for a spin by creating an L2 Cross Connect where any ethernet frame
received on Gi1/0/0 will be directly transmitted as-is on Gi3/0/0 and vice versa. This is a
relatively cheap operation for VPP, as it will not have to do any routing table lookups. The
configuration looks like this:
pim@fitlet:~$ cat << EOF > l2xc.yaml
interfaces:
  GigabitEthernet1/0/0:
    mtu: 1500
    l2xc: GigabitEthernet3/0/0
  GigabitEthernet3/0/0:
    mtu: 1500
    l2xc: GigabitEthernet1/0/0
EOF
pim@fitlet:~$ vppcfg plan -c l2xc.yaml
[INFO    ] root.main: Loading configfile l2xc.yaml
[INFO    ] vppcfg.config.valid_config: Configuration validated successfully
[INFO    ] root.main: Configuration is valid
[INFO    ] vppcfg.vppapi.connect: VPP version is 23.06-rc0~35-gaf4046134
comment { vppcfg sync: 10 CLI statement(s) follow }
set interface l2 xconnect GigabitEthernet1/0/0 GigabitEthernet3/0/0
set interface l2 tag-rewrite GigabitEthernet1/0/0 disable
set interface l2 xconnect GigabitEthernet3/0/0 GigabitEthernet1/0/0
set interface l2 tag-rewrite GigabitEthernet3/0/0 disable
set interface mtu 1500 GigabitEthernet1/0/0
set interface mtu 1500 GigabitEthernet3/0/0
set interface mtu packet 1500 GigabitEthernet1/0/0
set interface mtu packet 1500 GigabitEthernet3/0/0
set interface state GigabitEthernet1/0/0 up
set interface state GigabitEthernet3/0/0 up
[INFO    ] vppcfg.reconciler.write: Wrote 11 lines to (stdout)
[INFO    ] root.main: Planning succeeded
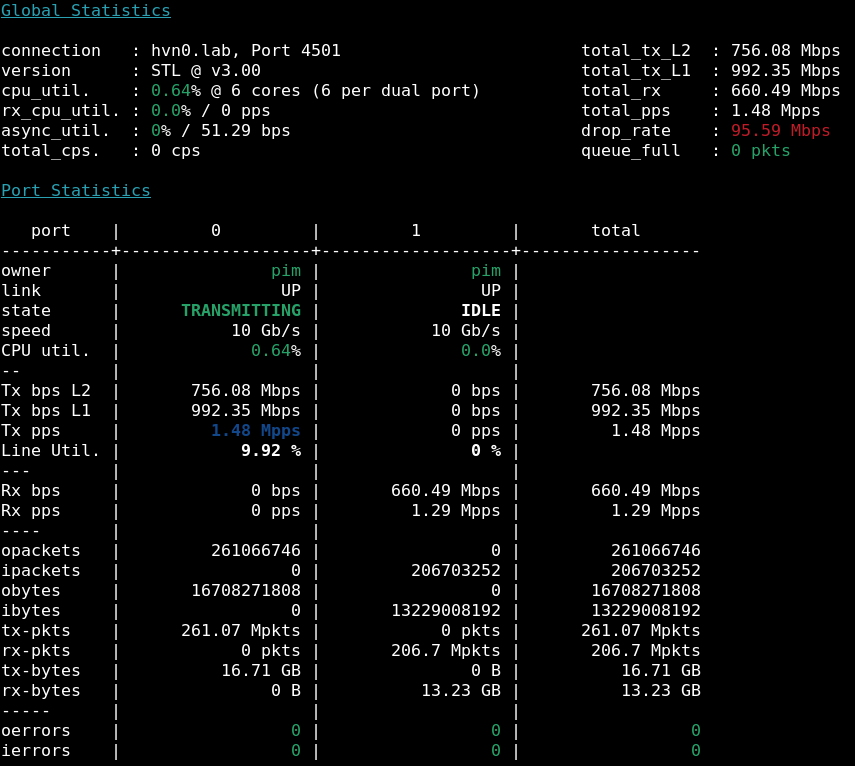
After I paste these commands on the CLI, I start T-Rex in L2 stateless mode, and start T-Rex, I can
generate some activity by starting the bench profile on port 0 with packets of 64 bytes in size
and with varying IPv4 source and destination addresses and ports:
tui>start -f stl/bench.py -m 1.48mpps -p 0
          -t size=64,vm=var2
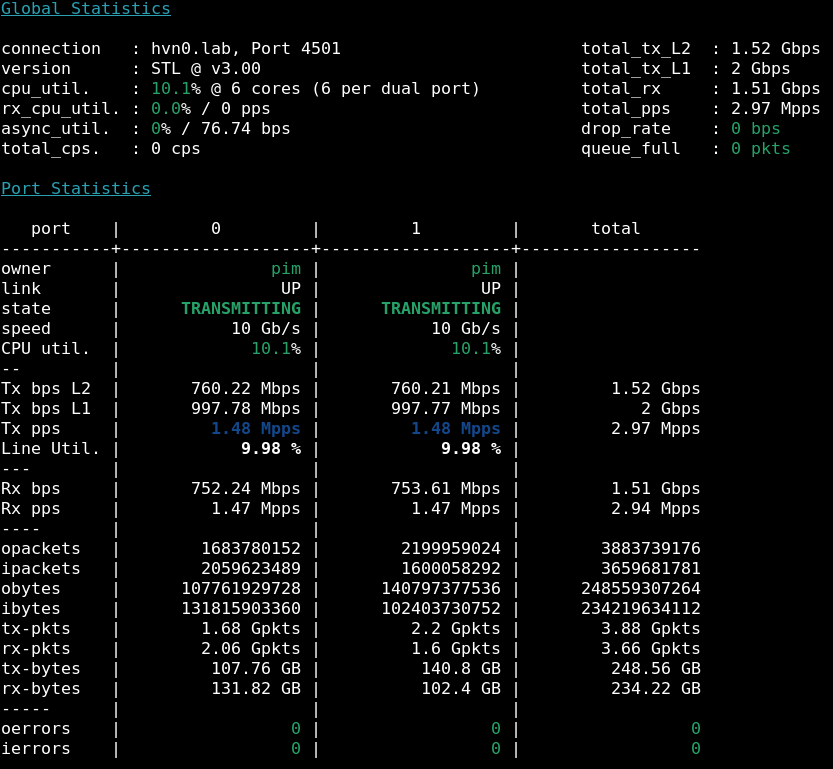
Let me explain a few hilights from the picture to the right. When starting this profile, I
specified 1.48Mpps, which is the maximum amount of packets/second that can be generated on a 1Gbit
link when using 64 byte frames (the smallest permissible ethernet frames). I do this because the
loadtester comes with 10Gbit (and 100Gbit) ports, but the Fitlet2 has only 1Gbit ports. Then, I see
that port0 is indeed transmitting (Tx pps) 1.48 Mpps, shown in dark blue. This is about 992 Mbps
on the wire (the Tx bps L1), but due to the overhead of ethernet (each 64 byte ethernet frame
needs an additional 20 bytes [details]), so the Tx
bps L2 is about 64/84 * 992.35 = 756.08 Mbps, which lines up.
Then, after the Fitlet2 tries its best to forward those from its receiving Gi1/0/0 port onto its transmitting port Gi3/0/0, they are received again by T-Rex on port 1. Here, I can see that the Rx pps is 1.29 Mpps, with an Rx bps of 660.49 Mbps (which is the L2 counter), and in bright red at the top I see the drop_rate is about 95.59 Mbps. In other words, the Fitlet2 is not keeping up.
But, after I take a look at the runtime statistics, I see that the CPU isn’t very busy at all:
vpp# show run
...
Thread 1 vpp_wk_0 (lcore 1)
Time 23.8, 10 sec internal node vector rate 4.30 loops/sec 1638976.68
  vector rates in 1.2908e6, out 1.2908e6, drop 0.0000e0, punt 0.0000e0
             Name              State      Calls    Vectors  Suspends   Clocks  Vectors/Call
GigabitEthernet3/0/0-output   active    6323688   27119700         0   9.14e1          4.29
GigabitEthernet3/0/0-tx       active    6323688   27119700         0   1.79e2          4.29
dpdk-input                   polling   44406936   27119701         0   5.35e2           .61
ethernet-input                active    6323689   27119701         0   1.42e2          4.29
l2-input                      active    6323689   27119701         0   9.94e1          4.29
l2-output                     active    6323689   27119701         0   9.77e1          4.29
Very interesting! Notice that the line above says vector rates in .. out .. are saying that the
thread is receiving only 1.29Mpps, and it is managing to send all of them out as well. When a VPP
worker is busy, each DPDK call will yield many packets, up to 256 in one call, which means the
amount of “vectors per call” will rise. Here, I see that on average, DPDK is returning an average of
only 0.61 packets each time it polls the NIC, and in each time a bunch of the packets are sent off
into the VPP graph, there is an average of 4.29 packets per loop. If the CPU was the bottleneck, it
would look more like 256 in the Vectors/Call column – so the bottleneck must be in the NIC.
Remember above, when I showed the show hardware command output? There’s a clue in there. The
Fitlet2 has two onboard i211 NICs and one i210 NIC on the FACET card. Despite the lower number,
the i210 is a bit more advanced
[datasheet]. If I reverse the
direction of flow (so receiving on the i210 Gi3/0/0, and transmitting on the i211 Gi1/0/0), things
look a fair bit better:
vpp# show run
...
Thread 1 vpp_wk_0 (lcore 1)
Time 12.6, 10 sec internal node vector rate 4.02 loops/sec 853956.73
  vector rates in 1.4799e6, out 1.4799e6, drop 0.0000e0, punt 0.0000e0
             Name              State      Calls    Vectors  Suspends   Clocks  Vectors/Call
GigabitEthernet1/0/0-output   active    4642964   18652932         0   9.34e1          4.02
GigabitEthernet1/0/0-tx       active    4642964   18652420         0   1.73e2          4.02
dpdk-input                   polling   12200880   18652933         0   3.27e2          1.53
ethernet-input                active    4642965   18652933         0   1.54e2          4.02
l2-input                      active    4642964   18652933         0   1.04e2          4.02
l2-output                     active    4642964   18652933         0   1.01e2          4.02
Hey, would you look at that! The line up top here shows vector rates of in 1.4799e6 (which is 1.48Mpps) and outbound is the same number. And in this configuration as well, the DPDK node isn’t even reading that many packets, and the graph traversal is on average with 4.02 packets per run, which means that this CPU can do in excess of 1.48Mpps on one (1) CPU thread. Slick!
So what is the maximum throughput per CPU thread? To show this, I will saturate both ports with line rate traffic, and see what makes it through the other side. After instructing the T-Rex to perform the following profile:
tui>start -f stl/bench.py -m 1.48mpps -p 0 1 \
          -t size=64,vm=var2
T-Rex will faithfully start to send traffic on both ports and expect the same amount back from the Fitlet2 (the Device Under Test or DUT). I can see that from T-Rex port 1->0 all traffic makes its way back, but from port 0->1 there is a little bit of loss (for the 1.48Mpps sent, only 1.43Mpps is returned). This is the same phenomenon that I explained above – the i211 NIC is not quite as good at eating packets as the i210 NIC is.
Even when doing this though, the (still) single threaded VPP is keeping up just fine, CPU wise:
vpp# show run
...
Thread 1 vpp_wk_0 (lcore 1)
Time 13.4, 10 sec internal node vector rate 13.59 loops/sec 122820.33
  vector rates in 2.9599e6, out 2.8834e6, drop 0.0000e0, punt 0.0000e0
             Name              State     Calls    Vectors   Suspends   Clocks  Vectors/Call
GigabitEthernet1/0/0-output   active   1822674   19826616          0   3.69e1         10.88
GigabitEthernet1/0/0-tx       active   1822674   19597360          0   1.51e2         10.75
GigabitEthernet3/0/0-output   active   1823770   19826612          0   4.79e1         10.87
GigabitEthernet3/0/0-tx       active   1823770   19029508          0   1.56e2         10.43
dpdk-input                   polling   1827320   39653228          0   1.62e2         21.70
ethernet-input                active   3646444   39653228          0   7.67e1         10.87
l2-input                      active   1825356   39653228          0   4.96e1         21.72
l2-output                     active   1825356   39653228          0   4.58e1         21.72
Here we can see 2.96Mpps received (vector rates in) while only 2.88Mpps are transmitted (vector rates out). First off, this lines up perfectly with the reporting of T-Rex in the screenshot above, and it also shows that one direction loses more packets than the other. We’re dropping some 80kpps, but where did they go? Looking at the statistics counters, which include any packets which had errors in processing, we learn more:
vpp# show err
   Count                  Node                              Reason               Severity
3109141488             l2-output                      L2 output packets            error
3109141488              l2-input                       L2 input packets            error
   9936649      GigabitEthernet1/0/0-tx       Tx packet drops (dpdk tx failure)    error
  32120469      GigabitEthernet3/0/0-tx       Tx packet drops (dpdk tx failure)    error
Aha! From previous experience I know that when DPDK signals packet drops due to ’tx failure’,
that this is often because it’s trying to hand off the packet to the NIC, which has a ringbuffer to
collect them while the hardware transmits them onto the wire, and this NIC has run out of slots,
which means the packet has to be dropped and a kitten gets hurt. But, I can raise the number of
RX and TX slots, by setting them in VPP’s startup.conf file:
dpdk {
  dev default {
    num-rx-desc 512   ## default
    num-tx-desc 1024
  }
  no-multi-seg
}
And with that simple tweak, I’ve succeeded in configuring the Fitlet2 in a way that it is capable of receiving and transmitting 64 byte packets in both directions at (almost) line rate, with one CPU thread.
Method 2: Rampup using trex-loadtest.py
For this test, I decide to put the Fitlet2 into L3 mode (up until now it was set up in L2 Cross
Connect mode). To do this, I give the interfaces an IPv4 address and set a route for the loadtest
traffic (which will be coming from 16.0.0.0/8 and going to 48.0.0.0/8). I will once again look
to vppcfg to do this, because manipulating the YAML files like this allow me to easily and reliabily
swap back and forth, letting vppcfg do the mundane chore of figuring out what commands to type, in
which order, safely.
From my existing L2XC dataplane configuration, I switch to L3 like so:
pim@fitlet:~$ cat << EOF > l3.yaml
interfaces:
  GigabitEthernet1/0/0:
    mtu: 1500
    lcp: e1-0-0
    addresses: [ 100.64.10.1/30 ]
  GigabitEthernet3/0/0:
    mtu: 1500
    lcp: e3-0-0
    addresses: [ 100.64.10.5/30 ]
EOF
pim@fitlet:~$ vppcfg plan -c l3.yaml
[INFO    ] root.main: Loading configfile l3.yaml
[INFO    ] vppcfg.config.valid_config: Configuration validated successfully
[INFO    ] root.main: Configuration is valid
[INFO    ] vppcfg.vppapi.connect: VPP version is 23.06-rc0~35-gaf4046134
comment { vppcfg prune: 2 CLI statement(s) follow }
set interface l3 GigabitEthernet1/0/0
set interface l3 GigabitEthernet3/0/0
comment { vppcfg create: 2 CLI statement(s) follow }
lcp create GigabitEthernet1/0/0 host-if e1-0-0
lcp create GigabitEthernet3/0/0 host-if e3-0-0
comment { vppcfg sync: 2 CLI statement(s) follow }
set interface ip address GigabitEthernet1/0/0 100.64.10.1/30
set interface ip address GigabitEthernet3/0/0 100.64.10.5/30
[INFO    ] vppcfg.reconciler.write: Wrote 9 lines to (stdout)
[INFO    ] root.main: Planning succeeded
One small note – vppcfg cannot set routes, and this is by design as the Linux Control Plane is
meant to take care of that. I can either set routes using ip in the dataplane network namespace,
like so:
pim@fitlet:~$ sudo nsenter --net=/var/run/netns/dataplane
root@fitlet:/home/pim# ip route add 16.0.0.0/8 via 100.64.10.2
root@fitlet:/home/pim# ip route add 48.0.0.0/8 via 100.64.10.6
Or, alternatively, I can set them directly on VPP in the CLI, interestingly with identical syntax:
pim@fitlet:~$ vppctl
vpp# ip route add 16.0.0.0/8 via 100.64.10.2
vpp# ip route add 48.0.0.0/8 via 100.64.10.6
The loadtester will run a bunch of profiles (1514b, imix, 64b with multiple flows, and 64b with only one flow), either in unidirectional or bidirectional mode, which gives me a wealth of data to share:
| Loadtest | 1514b | imix | Multi 64b | Single 64b |
|---|---|---|---|---|
| Bidirectional | 81.7k (100%) | 327k (100%) | 1.48M (100%) | 1.43M (98.8%) |
| Unidirectional | 73.2k (89.6%) | 255k (78.2%) | 1.18M (79.4%) | 1.23M (82.7%) |
Caveats
While all results of the loadtests are navigable [here], I will cherrypick one interesting bundle showing the results of all (bi- and unidirectional) tests:
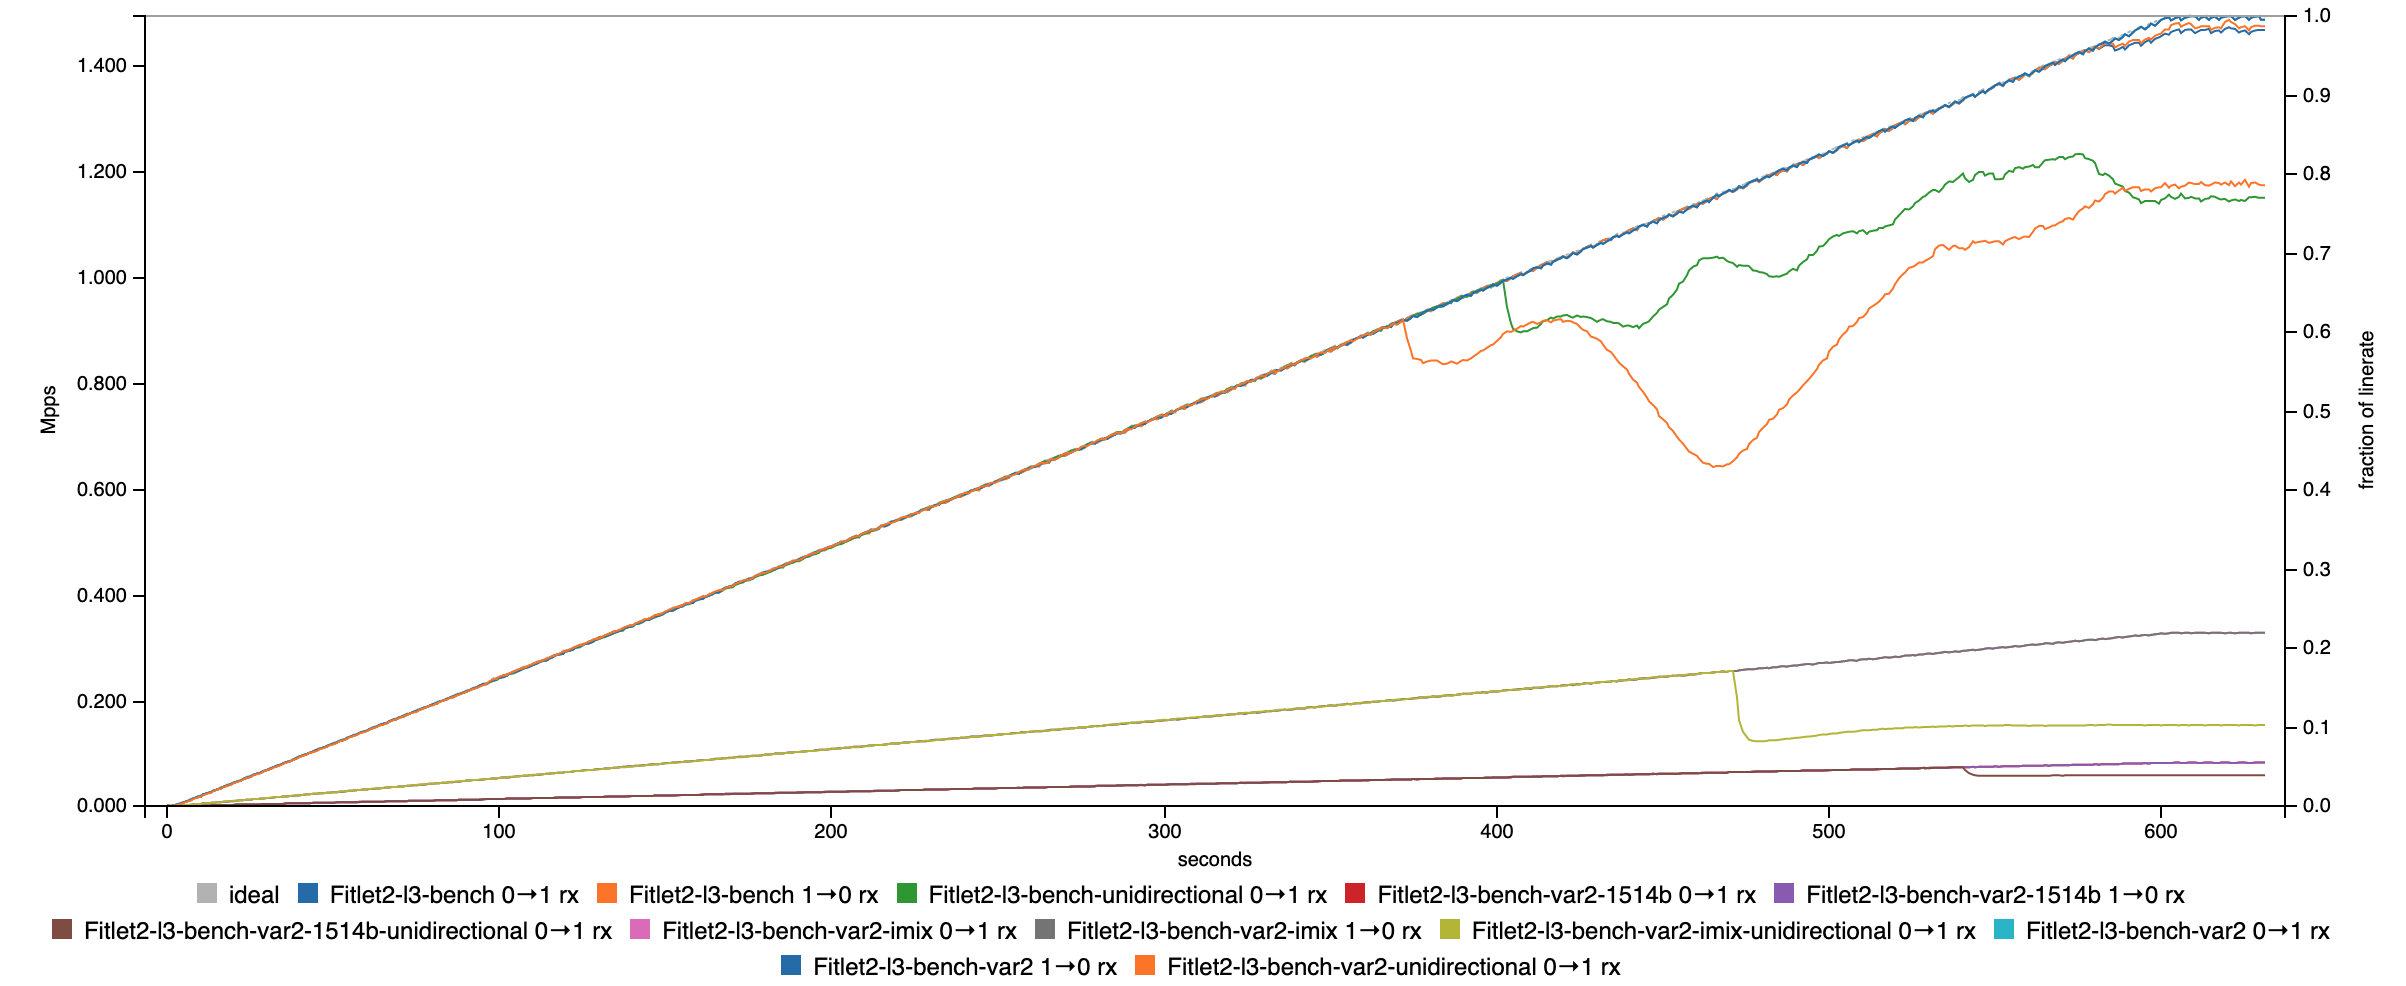
I have to admit I was a bit stumped with the unidirectional loadtests - these are pushing traffic into the i211 (onboard RJ45) NIC, and out of the i210 (FACET SFP) NIC. What I found super weird (and can’t really explain), is that the unidirectional load, which in the end serves half the packets/sec, is lower than the bidirectional load, which was almost perfect dropping only a little bit of traffic at the very end. A picture says a thousand words - so here’s a graph of all the loadtests, which you can also find by clicking on the links in the table.
Appendix
Generating the data
The JSON files that are emitted by my loadtester script can be fed directly into Michal’s visualizer to plot interactive graphs (which I’ve done for the table above):
DEVICE=Fitlet2

## Loadtest

SERVER=${SERVER:=hvn0.lab.ipng.ch}
TARGET=${TARGET:=l3}
RATE=${RATE:=10} ## % of line
DURATION=${DURATION:=600}
OFFSET=${OFFSET:=10}
PROFILE=${PROFILE:="ipng"}

for DIR in unidirectional bidirectional; do
  for SIZE in 1514 imix 64; do
    [ $DIR == "unidirectional" ] && FLAGS="-u "
    ## Multiple Flows
    ./trex-loadtest -s ${SERVER} ${FLAGS} -p $PROFILE}.py -t "offset=${OFFSET},vm=var2,size=${SIZE}" \
      -rd ${DURATION} -rt ${RATE} -o ${DEVICE}-${TARGET}-${PROFILE}-var2-${SIZE}-${DIR}.json

    [ $SIZE -eq 64 ] && {
      ## Specialcase: Single Flow
      ./trex-loadtest -s ${SERVER} ${FLAGS -p ${PROFILE}.py -t "offset=${OFFSET},size=${SIZE}" \
        -rd ${DURATION} -rt ${RATE} -o ${DEVICE}-${TARGET}-${PROFILE}-${SIZE}-${DIR}.json
    }
  done
done

## Graphs

ruby graph.rb -t "${DEVICE} All Loadtests" ${DEVICE}*.json -o ${DEVICE}.html
ruby graph.rb -t "${DEVICE} Unidirectional Loadtests" ${DEVICE}*unidir*.json \
  -o ${DEVICE}.unidirectional.html
ruby graph.rb -t "${DEVICE} Bidirectional Loadtests" ${DEVICE}*bidir*.json \
  -o ${DEVICE}.bidirectional.html

for i in ${PROFILE}-var2-1514 ${PROFILE}-var2-imix ${PROFILE}-var2-64 ${PROFILE}-64; do
  ruby graph.rb -t "${DEVICE} Unidirectional Loadtests" ${DEVICE}*-${i}*unidirectional.json \
    -o ${DEVICE}.$i-unidirectional.html; done
  ruby graph.rb -t "${DEVICE} Bidirectional Loadtests"  ${DEVICE}*-${i}*bidirectional.json \
    -o ${DEVICE}.$i-bidirectional.html; done
done