About this series
Ever since I first saw VPP - the Vector Packet Processor - I have been deeply impressed with its performance and versatility. For those of us who have used Cisco IOS/XR devices, like the classic ASR (aggregation service router), VPP will look and feel quite familiar as many of the approaches are shared between the two.
I’ve been working on the Linux Control Plane [ref], which you can read all about in my series on VPP back in 2021:
 {: style=“width:300px; float: right; margin-left: 1em;”}
- [Part 1]: Punting traffic through TUN/TAP interfaces into Linux
- [Part 2]: Mirroring VPP interface configuration into Linux
- [Part 3]: Automatically creating sub-interfaces in Linux
- [Part 4]: Synchronize link state, MTU and addresses to Linux
- [Part 5]: Netlink Listener, synchronizing state from Linux to VPP
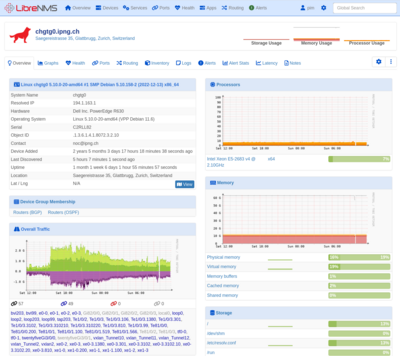
- [Part 6]: Observability with LibreNMS and VPP SNMP Agent
- [Part 7]: Productionizing and reference Supermicro fleet at IPng
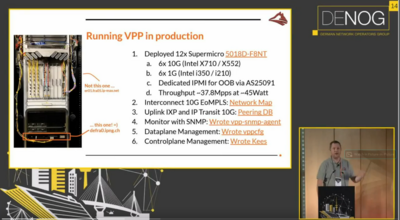
With this, I can make a regular server running Linux use VPP as kind of a software ASIC for super fast forwarding, filtering, NAT, and so on, while keeping control of the interface state (links, addresses and routes) itself. With Linux CP, running software like FRR or Bird on top of VPP and achieving >150Mpps and >180Gbps forwarding rates are easily in reach. If you find that hard to believe, check out [my DENOG14 talk] or click the thumbnail above. I am continuously surprised at the performance per watt, and the performance per Swiss Franc spent.
Monitoring VPP
Of course, it’s important to be able to see what routers are doing in production. For the longest time, the de facto standard for monitoring in the networking industry has been Simple Network Management Protocol (SNMP), described in [RFC 1157]. But there’s another way, using a metrics and time series system called Borgmon, originally designed by Google [ref] but popularized by Soundcloud in an open source interpretation called Prometheus [ref]. IPng Networks ♥ Prometheus.
I’m a really huge fan of Prometheus and its graphical frontend Grafana, as you can see with my work on Mastodon in [this article]. Join me on [ublog.tech] if you haven’t joined the Fediverse yet. It’s well monitored!
SNMP
SNMP defines an extensible model by which parts of the OID (object identifier) tree can be delegated to another process, and the main SNMP daemon will call out to it using an AgentX protocol, described in [RFC 2741]. In a nutshell, this allows an external program to connect to the main SNMP daemon, register an interest in certain OIDs, and get called whenever the SNMPd is being queried for them.

The flow is pretty simple (see section 6.2 of the RFC), the Agent (client):
- opens a TCP or Unix domain socket to the SNMPd
- sends an Open PDU, which the server will respond or reject.
- (optionally) can send a Ping PDU, the server will respond.
- registers an interest with Register PDU
It then waits and gets called by the SNMPd with Get PDUs (to retrieve one single value), GetNext PDU (to enable snmpwalk), GetBulk PDU (to retrieve a whole subsection of the MIB), all of which are answered by a Response PDU.
Using parts of a Python Agentx library written by GitHub user hosthvo [ref], I tried my hands at writing one of these AgentX’s. The resulting source code is on [GitHub]. That’s the one that’s running in production ever since I started running VPP routers at IPng Networks AS8298. After the AgentX exposes the dataplane interfaces and their statistics into SNMP, an open source monitoring tool such as LibreNMS [ref] can discover the routers and draw pretty graphs, as well as detect when interfaces go down, or are overloaded, and so on. That’s pretty slick.
VPP Stats Segment in Go
But if I may offer some critique on my own approach, SNMP monitoring is very 1990s. I’m
continously surpsied that our industry is still clinging on to this archaic approach. VPP offers
a lot of observability, its statistics segment is chock full of interesting counters and gauges
that can be really helpful to understand how the dataplane performs. If there are errors or a
bottleneck develops in the router, going over show runtime or show errors can be a life saver.
Let’s take another look at that Stats Segment (the one that the SNMP AgentX connects to in order to
query it for packets/byte counters and interface names).
You can think of the Stats Segment as a directory hierarchy where each file represents a type of counter. VPP comes with a small helper tool called VPP Stats FS, which uses a FUSE based read-only filesystem to expose those counters in an intuitive way, so let’s take a look
pim@hippo:~/src/vpp/extras/vpp_stats_fs$ sudo systemctl start vpp
pim@hippo:~/src/vpp/extras/vpp_stats_fs$ sudo make start
pim@hippo:~/src/vpp/extras/vpp_stats_fs$ mount | grep stats
rawBridge on /run/vpp/stats_fs_dir type fuse.rawBridge (rw,nosuid,nodev,relatime,user_id=0,group_id=0,allow_other)

pim@hippo:/run/vpp/stats_fs_dir$ ls -la
drwxr-xr-x 0 root root 0 Apr  9 14:07 bfd
drwxr-xr-x 0 root root 0 Apr  9 14:07 buffer-pools
drwxr-xr-x 0 root root 0 Apr  9 14:07 err
drwxr-xr-x 0 root root 0 Apr  9 14:07 if
drwxr-xr-x 0 root root 0 Apr  9 14:07 interfaces
drwxr-xr-x 0 root root 0 Apr  9 14:07 mem
drwxr-xr-x 0 root root 0 Apr  9 14:07 net
drwxr-xr-x 0 root root 0 Apr  9 14:07 node
drwxr-xr-x 0 root root 0 Apr  9 14:07 nodes
drwxr-xr-x 0 root root 0 Apr  9 14:07 sys

pim@hippo:/run/vpp/stats_fs_dir$ cat sys/boottime
1681042046.00
pim@hippo:/run/vpp/stats_fs_dir$ date +%s
1681042058
pim@hippo:~/src/vpp/extras/vpp_stats_fs$ sudo make stop
There’s lots of really interesting stuff in here - for example in the /sys hierarchy we can see a
boottime file, and from there I can determine the uptime of the process. Further, the /mem
hierarchy shows the current memory usage for each of the main, api and stats segment heaps.
And of course, in the /interfaces hierarchy we can see all the usual packets and bytes counters
for any interface created in the dataplane.
VPP Stats Segment in C
I wish I were good at Go, but I never really took to the language. I’m pretty good at Python, but
sorting through the stats segment isn’t super quick as I’ve already noticed in the Python3 based
[VPP SNMP Agent]. I’m probably the world’s least
terrible C programmer, so maybe I can take a look at the VPP Stats Client and make sense of it. Luckily,
there’s an example already in src/vpp/app/vpp_get_stats.c and it reveals the following pattern:
- assemble a vector of regular expression patterns in the hierarchy, or just
^/to start - get a handle to the stats segment with
stats_segment_ls()using the pattern(s) - use the handle to dump the stats segment into a vector with
stat_segment_dump(). - iterate over the returned stats structure, each element has a type and a given name:
- STAT_DIR_TYPE_SCALAR_INDEX: these are floating point doubles
- STAT_DIR_TYPE_COUNTER_VECTOR_SIMPLE: single uint32 counter
- STAT_DIR_TYPE_COUNTER_VECTOR_COMBINED: two uint32 counters
- freeing the used stats structure with
stat_segment_data_free()
The simple and combined stats turn out to be associative arrays, the outer of which notes the thread and the inner of which refers to the index. As such, a statistic of type VECTOR_SIMPLE can be decoded like so:
if (res[i].type == STAT_DIR_TYPE_COUNTER_VECTOR_SIMPLE)
  for (k = 0; k < vec_len (res[i].simple_counter_vec); k++)
    for (j = 0; j < vec_len (res[i].simple_counter_vec[k]); j++)
      printf ("[%d @ %d]: %llu packets %s\n", j, k, res[i].simple_counter_vec[k][j], res[i].name);
The statistic of type VECTOR_COMBINED is very similar, except the union type there is a
combined_counter_vec[k][j] which has a member .packets and a member called .bytes. The
simplest form, SCALAR_INDEX, is just a single floating point number attached to the name.
In principle, this should be really easy to sift through and decode. Now that I’ve figured that
out, let me dump a bunch of stats with the vpp_get_stats tool that comes with vanilla VPP:
pim@chrma0:~$ vpp_get_stats dump /interfaces/TenGig.*40121 | grep -v ': 0'
[0 @ 2]: 67057 packets /interfaces/TenGigabitEthernet81_0_0.40121/drops
[0 @ 2]: 76125287 packets /interfaces/TenGigabitEthernet81_0_0.40121/ip4
[0 @ 2]: 1793946 packets /interfaces/TenGigabitEthernet81_0_0.40121/ip6
[0 @ 2]: 77919629 packets, 66184628769 bytes /interfaces/TenGigabitEthernet81_0_0.40121/rx
[0 @ 0]: 7 packets, 610 bytes /interfaces/TenGigabitEthernet81_0_0.40121/tx
[0 @ 1]: 26687 packets, 18771919 bytes /interfaces/TenGigabitEthernet81_0_0.40121/tx
[0 @ 2]: 6448944 packets, 3663975508 bytes /interfaces/TenGigabitEthernet81_0_0.40121/tx
[0 @ 3]: 138924 packets, 20599785 bytes /interfaces/TenGigabitEthernet81_0_0.40121/tx
[0 @ 4]: 130720342 packets, 57436383614 bytes /interfaces/TenGigabitEthernet81_0_0.40121/tx
I can see both types of counter at play here, let me explain the first line: it is saying that the
counter of name /interfaces/TenGigabitEthernet81_0_0.40121/drops, at counter index 0, CPU thread
2, has a simple counter with value 67057. Taking the last line, this is a combined counter type with
name /interfaces/TenGigabitEthernet81_0_0.40121/tx at index 0, all five CPU threads (the main
thread and four worker threads) have all sent traffic into this interface, and the counters for each
in packets and bytes is given.
For readability’s sake, my grep -v above doesn’t print any counter that is 0. For example,
interface Te81/0/0 has only one receive queue, and it’s bound to thread 2. The other threads will
not receive any packets for it, consequently their rx counters stay zero:
pim@chrma0:~/src/vpp$ vpp_get_stats dump /interfaces/TenGig.*40121 | grep rx$
[0 @ 0]: 0 packets, 0 bytes /interfaces/TenGigabitEthernet81_0_0.40121/rx
[0 @ 1]: 0 packets, 0 bytes /interfaces/TenGigabitEthernet81_0_0.40121/rx
[0 @ 2]: 80720186 packets, 68458816253 bytes /interfaces/TenGigabitEthernet81_0_0.40121/rx
[0 @ 3]: 0 packets, 0 bytes /interfaces/TenGigabitEthernet81_0_0.40121/rx
[0 @ 4]: 0 packets, 0 bytes /interfaces/TenGigabitEthernet81_0_0.40121/rx
Hierarchy: Pattern Matching
I quickly discover a pattern in most of these names: they start with a scope, say /interfaces,
then have a path entry for the interface name, and finally a specific counter (/rx or /mpls).
This is true also for the /nodes hiearchy, in which all VPP’s graph nodes have a set of counters:
pim@chrma0:~$ vpp_get_stats dump /nodes/ip4-lookup | grep -v ': 0'
[0 @ 1]: 11365675493301 packets /nodes/ip4-lookup/clocks
[0 @ 2]: 3256664129799 packets /nodes/ip4-lookup/clocks
[0 @ 3]: 28364098623954 packets /nodes/ip4-lookup/clocks
[0 @ 4]: 30198798628761 packets /nodes/ip4-lookup/clocks
[0 @ 1]: 80870763789 packets /nodes/ip4-lookup/vectors
[0 @ 2]: 17392446654 packets /nodes/ip4-lookup/vectors
[0 @ 3]: 259363625369 packets /nodes/ip4-lookup/vectors
[0 @ 4]: 298176625181 packets /nodes/ip4-lookup/vectors
[0 @ 1]: 49730112811 packets /nodes/ip4-lookup/calls
[0 @ 2]: 13035172295 packets /nodes/ip4-lookup/calls
[0 @ 3]: 109088424231 packets /nodes/ip4-lookup/calls
[0 @ 4]: 119789874274 packets /nodes/ip4-lookup/calls
If you’re ever seen the output of show runtime, it looks like this:
vpp# show runtime
Thread 1 vpp_wk_0 (lcore 28)
Time 3377500.2, 10 sec internal node vector rate 1.46 loops/sec 3301017.05
  vector rates in 2.7440e6, out 2.7210e6, drop 3.6025e1, punt 7.2243e-5
            Name     State   Calls        Vectors      Suspends    Clocks    Vectors/Call
...
ip4-lookup           active  49732141978  80873724903         0    1.41e2            1.63
Hey look! On thread 1, which is called vpp_wk_0 and is running on logical CPU core #28, there are
a bunch of VPP graph nodes that are all keeping stats of what they’ve been doing, and you can see
here that the following numbers line up between show runtime and the VPP Stats dumper:
- Name: This is the name of the VPP graph node, in this case
ip4-lookup, which is performing an IPv4 FIB lookup to figure out what the L3 nexthop is of a given IPv4 packet we’re trying to route. - Calls: How often did we invoke this graph node, 49.7 billion times so far.
- Vectors: How many packets did we push through, 80.87 billion, humble brag.
- Clocks: This one is a bit different – you can see the cumulative clock cycles spent by this CPU thread in the stats dump: 11365675493301 divided by 80870763789 packets is 140.54 CPU cycles per packet. It’s a cool interview question “How many CPU cycles does it take to do an IPv4 routing table lookup”. You now know the answer :-)
- Vectors/Call: This is a measure of how busy the node is (did it run for only one packet,
or for many packets?). On average when the worker thread gave the
ip4-lookupnode some work to do, there have been a total of 80873724903 packets handled in 49732141978 calls, so 1.626 packets per call. If ever you’re handling 256 packets per call (the most VPP will allow per call), your router will be sobbing.
Prometheus Metrics
Prometheus has metrics which carry a name, and zero or more labels. The prometheus query language
can then use these labels to do aggregation, division, averages, and so on. As a practical example,
above I looked at interface stats and saw that the Rx/Tx numbers were counted one per thread. If
we’d like the total on the interface, it would be great if we could sum without (thread,index),
which will have the effect of adding all of these numbers together.
For the monotonically increasing counter numbers (like the total vectors/calls/clocks per node), we
can take the running rate of change, showing the time spent over the last minute, or so. This way,
spikes in traffic will clearly correlate both with a spike in packets/sec or bytes/sec on the
interface, but also a higher number of vectors/call, and correspondingly typically a lower number
of clocks/vector, as VPP gets more efficient when it can re-use the CPU’s instruction and data
cache to do repeat work on multiple packets.
I decide to massage the statistic names a little bit, by transforming them of the basic format:
prefix_suffix{label="X",index="A",thread="B"} value
A few examples:
- The single counter that looks like
[6 @ 0]: 994403888 packets /mem/main heapbecomes:mem{heap="main heap",index="6",thread="0"}
- The combined counter
[0 @ 1]: 79582338270 packets, 16265349667188 bytes /interfaces/Te1_0_2/rxbecomes:interfaces_rx_packets{interface="Te1_0_2",index="0",thread="1"} 79582338270interfaces_rx_bytes{interface="Te1_0_2",index="0",thread="1"} 16265349667188
- The node information running on, say thread 4, becomes:
nodes_clocks{node="ip4-lookup",index="0",thread="4"} 30198798628761nodes_vectors{node="ip4-lookup",index="0",thread="4"} 298176625181nodes_calls{node="ip4-lookup",index="0",thread="4"} 119789874274nodes_suspends{node="ip4-lookup",index="0",thread="4"} 0
VPP Exporter
I wish I had things like split() and re.match() but in C (well, I guess I do have POSIX regular
expressions…), but it’s all a little bit more low level. Based on my basic loop that opens the
stats segment, registers its desired patterns, and then retrieves a vector of {name, type,
counter}-tuples, I decide to do a little bit of non-intrusive string tokenization first:
static int tokenize (const char *str, char delimiter, char **tokens, int *lengths) {
  char *p = (char *) str;
  char *savep = p;
  int i = 0;

  while (*p) if (*p == delimiter) {
      tokens[i] = (char *) savep;
      lengths[i] = (int) (p - savep);
      i++; p++; savep = p;
    } else p++;
  tokens[i] = (char *) savep;
  lengths[i] = (int) (p - savep);
  return i++;
}

/* The call site */
  char *tokens[10];
  int lengths[10];
  int num_tokens = tokenize (res[i].name, '/', tokens, lengths);
The tokenizer takes an array of N pointers to the resulting tokens, and their lengths. This sets it
aside from strtok() and friends, because those will overwrite the occurences of the delimiter in
the input string with \0, and as such cannot take a const char *str as input. This one leaves
the string alone though, and will return the tokens as {ptr, len}-tuples, including how many
tokens it found.
One thing I’ll probably regret is that there’s no bounds checking on the number of tokens – if I have more than 10 of these, I’ll come to regret it. But for now, the depth of the hierarchy is only 3, so I should be fine. Besides, I got into a fight with ChatGPT after it declared a romantic interest in my cat, so it won’t write code for me anymore :-(
But using this simple tokenizer, and knowledge of the structure of well known hierarchy paths, the
rest of the exporter is quickly in hand. Some variables don’t have a label (for example
/sys/boottime), but those that do will see that field transposed from the directory path
/mem/main heap/free into the label as I showed above.
Results

With this VPP Prometheus Exporter, I can now hook the VPP routers up to Prometheus and Grafana. Aggregations in Grafana are super easy and scalable, due to the conversion of the static paths into dynamically created labels on the prometheus metric names.
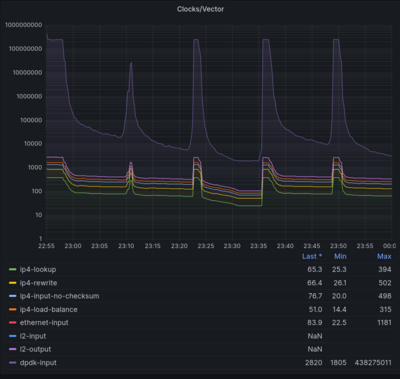
Drawing a graph of the running time spent by each individual VPP graph node might look something like this:
sum without (node)(rate(nodes_clocks[60s]))
  /
sum without (node)(rate(nodes_vectors[60s]))
The plot to the right shows a system under a loadtest that ramps up from 0% to 100% of line rate,
and the traces are the cummulative time spent in each node (on a logarithmic scale). The top purple
line represents dpdk-input. When a VPP dataplane is idle, the worker threads will be repeatedly
polling DPDK to ask it if it has something to do, spending 100% of their time being told “there is
nothing for you to do”. But, once load starts appearing, the other nodes start spending CPU time,
for example the chain of IPv4 forwarding is ethernet-input, ip4-input, ip4-lookup, followed by
ip4-rewrite and ultimately the packet is transmitted on some other interface. When the system is
lightly loaded, the ethernet-input node for example will spend 1100 or so CPU cycles per packet,
but when the machine is under higher load, the time spent will decrease to as low as 22 CPU cycles
per packet. This is true for almost all of the nodes - VPP gets relatively more efficient under
load.

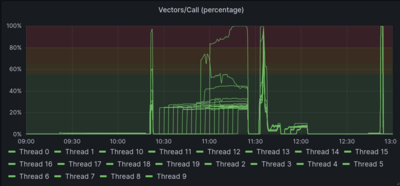
Another cool graph that I won’t be able to see when using only LibreNMS and SNMP polling, is how busy the router is. In VPP, each dispatch of the worker loop will poll DPDK and dispatch the packets through the directed graph of nodes that I showed above. But how many packets can be moved through the graph per CPU? The largest number of packets that VPP will ever offer into a call of the nodes is 256. Typically an unloaded machine will have an average number of Vectors/Call of around 1.00. When the worker thread is loaded, it may sit at around 130-150 Vectors/Call. If it’s saturated, it will quickly shoot up to 256.
As a good approximation, Vectors/Call normalized to 100% will be an indication of how busy the dataplane is. In the picture above, between 10:30 and 11:00 my test router was pushing about 180Gbps of traffic, but with large packets so its total vectors/call was modest (roughly 35-40), which you can see as all threads there are running in the ~25% load range. Then at 11:00 a few threads got hotter, and one of them completely saturated, and the traffic being forwarded by the CPU thread was suffering packetlo, even though the others were absolutely fine… forwarding 150Mpps on a 10 year old Dell R720!
What’s Next
Together with the graph above, I can also see how many CPU cycles are spent in which type of operation. For example, encapsulation of GENEVE or VxLAN is not free, although it’s also not every expensive. If I know how many CPU cycles are available (roughly the clock speed of the CPU threads, in our case Xeon X1518 (2.2GHz) or Xeon E5-2683 v4 CPUs (3GHz), I can pretty accurately calculate what a given mix of traffic and features is going to cost, and how many packets/sec our routers at IPng will be able to forward. Spoiler alert: it’s way more than currently needed. Our supermicros can handle roughly 35Mpps each, and considering a regular mixture of internet traffic (called imix) is about 3Mpps per 10G, I will have room to spare for the time being
This is super valuable information for folks running VPP in production.
I haven’t put the finishing touches on the VPP Prometheus Exporter, for example there are no
commandline flags yet, it doesn’t listen on any port other than 9482 (the same one that the toy
exporter in src/vpp/app/vpp_prometheus_export.c ships with
[ref]). My grafana
dashboard is also not fully completed yet. I hope to get that done in April, and publish both the
exporter and the dashboard on GitHub. Stay tuned!