Introduction

Last month, I picked up a project together with Neil McKee of [inMon], the
care takers of [sFlow]: an industry standard technology for monitoring high speed switched
networks. sFlow gives complete visibility into the use of networks enabling performance optimization,
accounting/billing for usage, and defense against security threats.
The open source software dataplane [VPP] is a perfect match for sampling, as it
forwards packets at very high rates using underlying libraries like [DPDK] and
[RDMA]. A clever design choice in the so
called Host sFlow Daemon [host-sflow], which allows for a small
portion of code to grab the samples, for example in a merchant silicon ASIC or FPGA, but also in the
VPP software dataplane, and then transmit these samples using a Linux kernel feature called
[PSAMPLE]. This greatly
reduces the complexity of code to be implemented in the forwarding path, while at the same time
bringing consistency to the sFlow delivery pipeline by (re)using the hsflowd business logic for
the more complex state keeping, packet marshalling and transmission from the Agent to a central
Collector.
Last month, Neil and I discussed the proof of concept [ref] and I described this in a [first article]. Then, we iterated on the VPP plugin, playing with a few different approaches to strike a balance between performance, code complexity, and agent features. This article describes our journey.
VPP: an sFlow plugin
There are three things Neil and I specifically take a look at:
- If
sFlowis not enabled on a given interface, there should not be a regression on other interfaces. - If
sFlowis enabled, but a packet is not sampled, the overhead should be as small as possible, targetting single digit CPU cycles per packet in overhead. - If
sFlowactually selects a packet for sampling, it should be moved out of the dataplane as quickly as possible, targetting double digit CPU cycles per sample.
For all these validation and loadtests, I use a bare metal VPP machine which is receiving load from a T-Rex loadtester on eight TenGig ports. I have configured VPP and T-Rex as follows.
1. RX Queue Placement
It’s important that the network card that is receiving the traffic, gets serviced by a worker thread on the same NUMA domain. Since my machine has two processors (and thus, two NUMA nodes), I will align the NIC with the correct processor, like so:
set interface rx-placement TenGigabitEthernet3/0/0 queue 0 worker 0
set interface rx-placement TenGigabitEthernet3/0/1 queue 0 worker 2
set interface rx-placement TenGigabitEthernet3/0/2 queue 0 worker 4
set interface rx-placement TenGigabitEthernet3/0/3 queue 0 worker 6

set interface rx-placement TenGigabitEthernet130/0/0 queue 0 worker 1
set interface rx-placement TenGigabitEthernet130/0/1 queue 0 worker 3
set interface rx-placement TenGigabitEthernet130/0/2 queue 0 worker 5
set interface rx-placement TenGigabitEthernet130/0/3 queue 0 worker 7
2. L3 IPv4/MPLS interfaces
I will take two pairs of interfaces, one on NUMA0, and the other on NUMA1, so that I can make a
comparison with L3 IPv4 or MPLS running without sFlow (these are TenGig3/0/, which I will call
the baseline pairs) and two which are running with sFlow (these are TenGig130/0/, which I’ll
call the experiment pairs).
comment { L3: IPv4 interfaces }
set int state TenGigabitEthernet3/0/0 up
set int state TenGigabitEthernet3/0/1 up
set int state TenGigabitEthernet130/0/0 up
set int state TenGigabitEthernet130/0/1 up
set int ip address TenGigabitEthernet3/0/0 100.64.0.1/31
set int ip address TenGigabitEthernet3/0/1 100.64.1.1/31
set int ip address TenGigabitEthernet130/0/0 100.64.4.1/31
set int ip address TenGigabitEthernet130/0/1 100.64.5.1/31
ip route add 16.0.0.0/24 via 100.64.0.0
ip route add 48.0.0.0/24 via 100.64.1.0
ip route add 16.0.2.0/24 via 100.64.4.0
ip route add 48.0.2.0/24 via 100.64.5.0
ip neighbor TenGigabitEthernet3/0/0 100.64.0.0 00:1b:21:06:00:00 static
ip neighbor TenGigabitEthernet3/0/1 100.64.1.0 00:1b:21:06:00:01 static
ip neighbor TenGigabitEthernet130/0/0 100.64.4.0 00:1b:21:87:00:00 static
ip neighbor TenGigabitEthernet130/0/1 100.64.5.0 00:1b:21:87:00:01 static
Here, the only specific trick worth mentioning is the use of ip neighbor to pre-populate the L2
adjacency for the T-Rex loadtester. This way, VPP knows which MAC address to send traffic to, in
case a packet has to be forwarded to 100.64.0.0 or 100.64.5.0. It avoids VPP from having to use ARP
resolution.
The configuration for an MPLS label switching router LSR or also called P-Router is added:
comment { MPLS interfaces }
mpls table add 0
set interface mpls TenGigabitEthernet3/0/0 enable
set interface mpls TenGigabitEthernet3/0/1 enable
set interface mpls TenGigabitEthernet130/0/0 enable
set interface mpls TenGigabitEthernet130/0/1 enable
mpls local-label add 16 eos via 100.64.1.0 TenGigabitEthernet3/0/1 out-labels 17
mpls local-label add 17 eos via 100.64.0.0 TenGigabitEthernet3/0/0 out-labels 16
mpls local-label add 20 eos via 100.64.5.0 TenGigabitEthernet130/0/1 out-labels 21
mpls local-label add 21 eos via 100.64.4.0 TenGigabitEthernet130/0/0 out-labels 20
3. L2 CrossConnect interfaces
Here, I will also use NUMA0 as my baseline (sFlow disabled) pair, and an equivalent pair of TenGig
interfaces on NUMA1 as my experiment (sFlow enabled) pair. This way, I can both make a comparison
on the performance impact of enabling sFlow, but I can also assert if any regression occurs in the
baseline pair if I enable a feature in the experiment pair, which should really never happen.
comment { L2 xconnected interfaces }
set int state TenGigabitEthernet3/0/2 up
set int state TenGigabitEthernet3/0/3 up
set int state TenGigabitEthernet130/0/2 up
set int state TenGigabitEthernet130/0/3 up
set int l2 xconnect TenGigabitEthernet3/0/2 TenGigabitEthernet3/0/3
set int l2 xconnect TenGigabitEthernet3/0/3 TenGigabitEthernet3/0/2
set int l2 xconnect TenGigabitEthernet130/0/2 TenGigabitEthernet130/0/3
set int l2 xconnect TenGigabitEthernet130/0/3 TenGigabitEthernet130/0/2
4. T-Rex Configuration
The Cisco T-Rex loadtester is running on another machine in the same rack. Physically, it has eight ports which are connected to a LAB switch, a cool Mellanox SN2700 running Debian [ref]. From there, eight ports go to my VPP machine. The LAB switch just has VLANs with two ports in each: VLAN 100 takes T-Rex port0 and connects it to TenGig3/0/0, VLAN 101 takes port1 and connects it to TenGig3/0/1, and so on. In total, sixteen ports and eight VLANs are used.
The configuration for T-Rex then becomes:
- version: 2
  interfaces: [ '06:00.0', '06:00.1', '83:00.0', '83:00.1', '87:00.0', '87:00.1', '85:00.0', '85:00.1' ]
  port_info:
    - src_mac:  00:1b:21:06:00:00
      dest_mac: 9c:69:b4:61:a1:dc
    - src_mac:  00:1b:21:06:00:01
      dest_mac: 9c:69:b4:61:a1:dd

    - src_mac:  00:1b:21:83:00:00
      dest_mac: 00:1b:21:83:00:01
    - src_mac:  00:1b:21:83:00:01
      dest_mac: 00:1b:21:83:00:00

    - src_mac:  00:1b:21:87:00:00
      dest_mac: 9c:69:b4:61:75:d0
    - src_mac:  00:1b:21:87:00:01
      dest_mac: 9c:69:b4:61:75:d1

    - src_mac:  9c:69:b4:85:00:00
      dest_mac: 9c:69:b4:85:00:01
    - src_mac:  9c:69:b4:85:00:01
      dest_mac: 9c:69:b4:85:00:00
Do you see how the first pair sends from src_mac 00:1b:21:06:00:00? That’s the T-Rex side, and it
encodes the PCI device 06:00.0 in the MAC address. It sends traffic to dest_mac
9c:69:b4:61:a1:dc, which is the MAC address of VPP’s TenGig3/0/0 interface. Looking back at the ip neighbor VPP config above, it becomes much easier to see who is sending traffic to whom.
For L2XC, the MAC addresses don’t matter. VPP will set the NIC in promiscuous mode which means it’ll accept any ethernet frame, not only those sent to the NIC’s own MAC address. Therefore, in L2XC modes (the second and fourth pair), I just use the MAC addresses from T-Rex. I find debugging connections and looking up FDB entries on the Mellanox switch much, much easier this way.
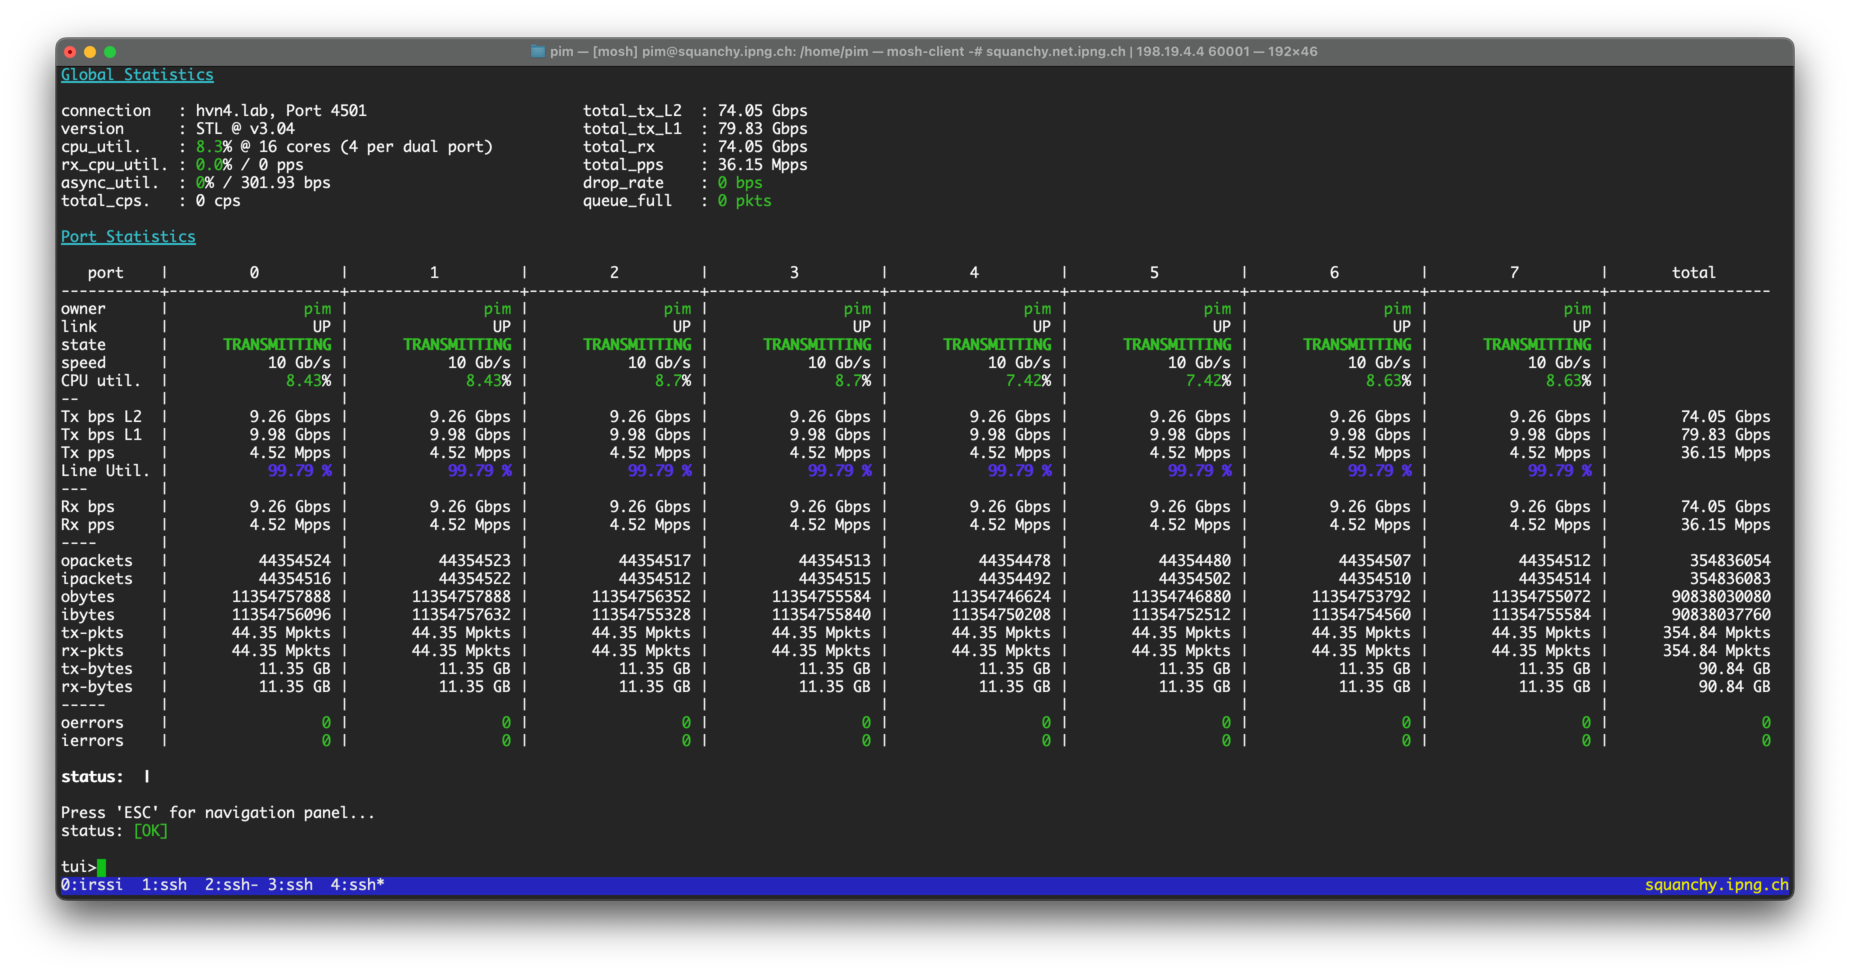
With all config in place, but with sFlow disabled, I run a quick bidirectional loadtest using 256b
packets at line rate, which shows 79.83Gbps and 36.15Mpps. All ports are forwarding, with MPLS,
IPv4, and L2XC. Neat!
The name of the game is now to do a loadtest that shows the packet throughput and CPU cycles spent
for each of the plugin iterations, comparing their performance on ports with and without sFlow
enabled. For each iteration, I will use exactly the same VPP configuration, I will generate
unidirectional 4x14.88Mpps of traffic with T-Rex, and I will report on VPP’s performance in
baseline and a somewhat unfavorable 1:100 sampling rate.
Ready? Here I go!
v1: Workers send RPC to main
TL/DR: 13 cycles/packet on passthrough, 4.68Mpps L2, 3.26Mpps L3, with severe regression in baseline
The first iteration goes all the way back to a proof of concept from last year. It’s described in detail in my [first post]. The performance results are not stellar:
- ☢ When slamming a single sFlow enabled interface, all interfaces regress. When sending 8Mpps of IPv4 traffic through an baseline interface, that is an interface without sFlow enabled, only 5.2Mpps get through. This is considered a mortal sin in VPP-land.
- ✅ Passing through packets without sampling them, costs about 13 CPU cycles, not bad.
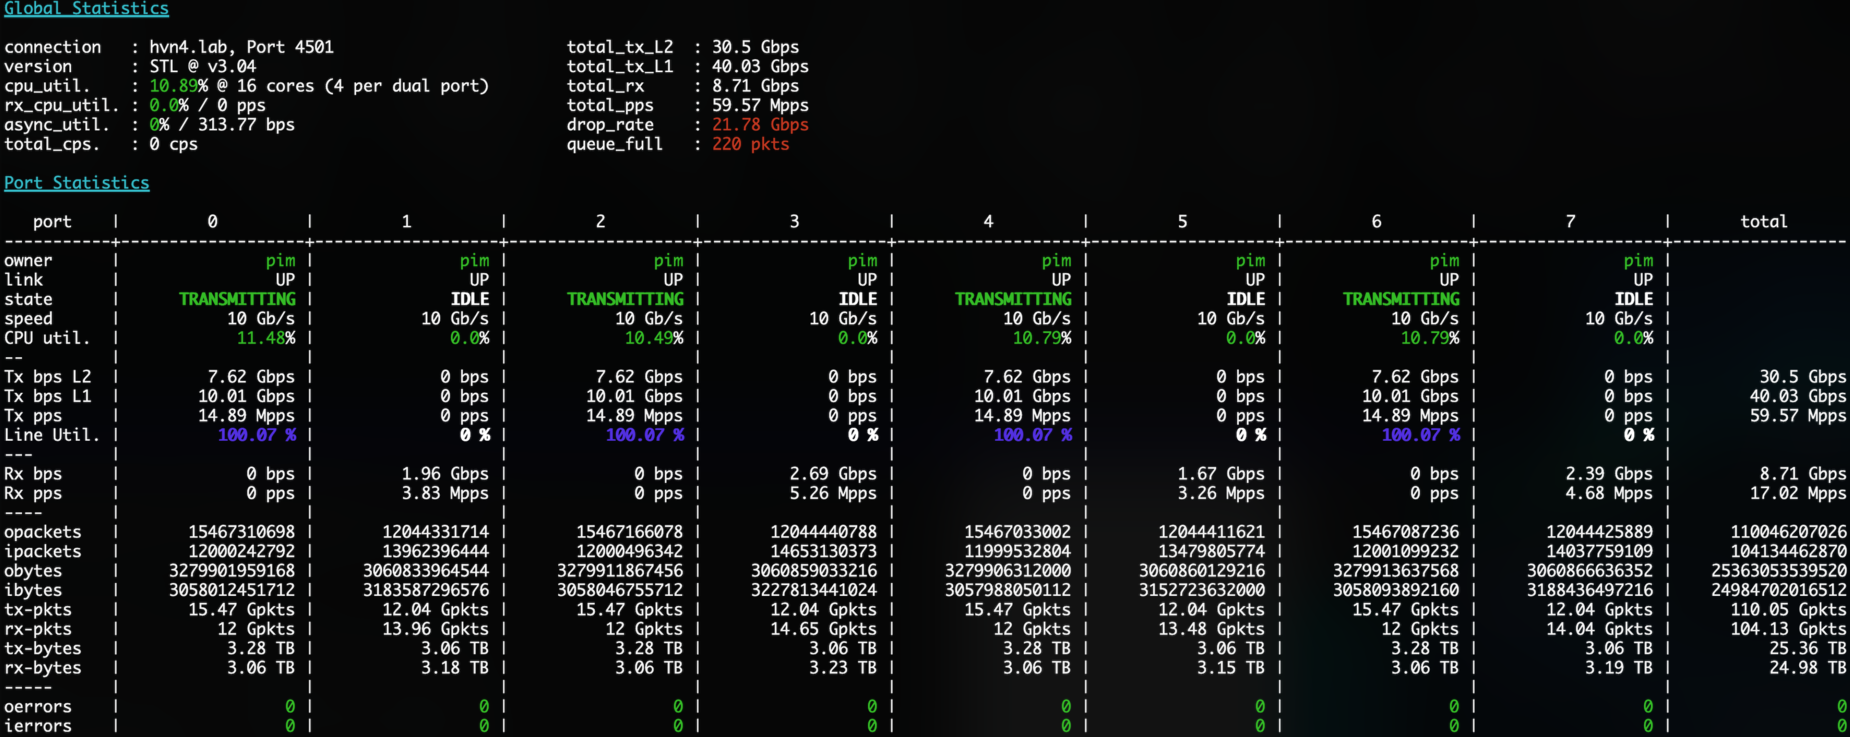
- ❌ Sampling a packet, specifically at higher rates (say, 1:100 or worse, 1:10) completely destroys throughput. When sending 4x14.88MMpps of traffic, only one third makes it through.
Here’s the bloodbath as seen from T-Rex:
Debrief: When we talked through these issues, we sort of drew the conclusion that it would be much faster if, when a worker thread produces a sample, instead of sending an RPC to main and taking the spinlock, that the worker appends the sample to a producer queue and moves on. This way, no locks are needed, and each worker thread will have its own producer queue.
Then, we can create a separate thread (or even pool of threads), scheduling on possibly a different CPU (or in main), that runs a loop iterating on all sflow sample queues, consuming the samples and sending them in batches to the PSAMPLE Netlink group, possibly dropping samples if there are too many coming in.
v2: Workers send PSAMPLE directly
TL/DR: 7.21Mpps IPv4 L3, 9.45Mpps L2XC, 87 cycles/packet, no impact on disabled interfaces
But before we do that, we have one curiosity itch to scratch - what if we sent the sample directly from the worker? With such a model, if it works, we will need no RPCs or sample queue at all. Of course, in this model any sample will have to be rewritten into a PSAMPLE packet and written via the netlink socket. It would be less complex, but not as efficient as it could be. One thing is prety certain, though: it should be much faster than sending an RPC to the main thread.
After short refactor, Neil commits [d278273],
which adds compiler macros SFLOW_SEND_FROM_WORKER (v2) and SFLOW_SEND_VIA_MAIN (v1). When
workers send directly, they will invoke sflow_send_sample_from_worker() instead of sending an RPC
with vl_api_rpc_call_main_thread() in the previous version.
The code currently uses clib_warning() to print stats from the dataplane, which is pretty
expensive. We should be using the VPP logging framework, but for the time being, I add a few CPU
counters so we can more accurately count the cummulative time spent for each part of the calls, see
[6ca61d2]. I can now see these with vppctl show err instead.
When loadtesting this, the deadly sin of impacting performance of interfaces that did not have
sFlow enabled is gone. The throughput is not great, though. Instead of showing screenshots of
T-Rex, I can also take a look at the throughput as measured by VPP itself. In its show runtime
statistics, each worker thread shows both CPU cycles spent, as well as how many packets/sec it
received and how many it transmitted:
pim@hvn6-lab:~$ export C="v2-100"; vppctl clear run; vppctl clear err; sleep 30; \
                vppctl show run > $C-runtime.txt; vppctl show err > $C-err.txt
pim@hvn6-lab:~$ grep 'vector rates' v2-100-runtime.txt  | grep -v 'in 0'
  vector rates in 1.0909e7, out 1.0909e7, drop 0.0000e0, punt 0.0000e0
  vector rates in 7.2078e6, out 7.2078e6, drop 0.0000e0, punt 0.0000e0
  vector rates in 1.4866e7, out 1.4866e7, drop 0.0000e0, punt 0.0000e0
  vector rates in 9.4476e6, out 9.4476e6, drop 0.0000e0, punt 0.0000e0
pim@hvn6-lab:~$ grep 'sflow' v2-100-runtime.txt
Name            State        Calls      Vectors  Suspends  Clocks    Vectors/Call
sflow           active      844916    216298496         0  8.69e1          256.00
sflow           active     1107466    283511296         0  8.26e1          256.00
pim@hvn6-lab:~$ grep -i sflow v2-100-err.txt
 217929472               sflow                     sflow packets processed         error
   1614519               sflow                      sflow packets sampled          error
2606893106               sflow                    CPU cycles in sent samples       error
 280697344               sflow                     sflow packets processed         error
   2078203               sflow                      sflow packets sampled          error
1844674406               sflow                    CPU cycles in sent samples       error
At a glance, I can see in the first grep, the in and out vector (==packet) rates for each worker
thread that is doing meaningful work (ie. has more than 0pps of input). Remember that I pinned the
RX queues to worker threads, and this now pays dividend: worker thread 0 is servicing TenGig3/0/0
(as even worker thread numbers are on NUMA domain 0), worker thread 1 is servicing TenGig130/0/0.
What’s cool about this, is it gives me an easy way to compare baseline L3 (10.9Mpps) with experiment
L3 (7.21Mpps). Equally, L2XC comes in at 14.88Mpps in baseline and 9.45Mpps in experiment.
Looking at the output of vppctl show error, I can learn another interesting detail. See how there
are 1614519 sampled packets out of 217929472 processed packets (ie. a roughly 1:100 rate)? I added a
CPU clock cycle counter that counts cummulative clocks spent once samples are taken. I can see that
VPP spent 2606893106 CPU cycles sending these samples. That’s 1615 CPU cycles per sent sample,
which is pretty terrible.
Debrief: We both understand that assembling and send()ing the netlink messages from within the
dataplane is a pretty bad idea. But it’s great to see that removing the use of RPCs immediately
improves performance on non-enabled interfaces, and we learned what the cost is of sending those
samples. An easy step forward from here is to create a producer/consumer queue, where the workers
can just copy the packet into a queue or ring buffer, and have an external pthread consume from
the queue/ring in another thread that won’t block the dataplane.
v3: SVM FIFO from workers, dedicated PSAMPLE pthread
TL/DR: 9.34Mpps L3, 13.51Mpps L2XC, 16.3 cycles/packet, but with corruption on the FIFO queue messages
Neil checks in after committing [7a78e05]
that he has introduced a macro SFLOW_SEND_FIFO which tries this new approach. There’s a pretty
elaborate FIFO queue implementation in svm/fifo_segment.h. Neil uses this to create a segment
called fifo-sflow-worker, to which the worker can write its samples in the dataplane node. A new
thread called spt_process_samples can then call svm_fifo_dequeue() from all workers’ queues and
pump those into Netlink.
The overhead of copying the samples onto a VPP native svm_fifo seems to be two orders of magnitude
lower than writing directly to Netlink, even though the svm_fifo library code has many bells and
whistles that we don’t need. But, perhaps due to these bells and whistles, we may be holding it
wrong, as invariably after a short while the Netlink writes return Message too long errors.
pim@hvn6-lab:~$ grep 'vector rates' v3fifo-sflow-100-runtime.txt  | grep -v 'in 0'
  vector rates in 1.0783e7, out 1.0783e7, drop 0.0000e0, punt 0.0000e0
  vector rates in 9.3499e6, out 9.3499e6, drop 0.0000e0, punt 0.0000e0
  vector rates in 1.4728e7, out 1.4728e7, drop 0.0000e0, punt 0.0000e0
  vector rates in 1.3516e7, out 1.3516e7, drop 0.0000e0, punt 0.0000e0
pim@hvn6-lab:~$ grep -i sflow v3fifo-sflow-100-runtime.txt
Name            State        Calls      Vectors  Suspends  Clocks    Vectors/Call
sflow           active     1096132    280609792         0  1.63e1          256.00
sflow           active     1584577    405651712         0  1.46e1          256.00
pim@hvn6-lab:~$ grep -i sflow v3fifo-sflow-100-err.txt
 280635904               sflow                     sflow packets processed         error
   2079194               sflow                      sflow packets sampled          error
 733447310               sflow                    CPU cycles in sent samples       error
 405689856               sflow                     sflow packets processed         error
   3004118               sflow                      sflow packets sampled          error
1844674407               sflow                    CPU cycles in sent samples       error
Two things of note here. Firstly, the average clocks spent in the sFlow node have gone down from
86 CPU cycles/packet to 16.3 CPU cycles. But even more importantly, the amount of time spent after
the sample is taken is hugely reduced, from 1600+ cycles in v2 to a much more favorable 352 cycles
in this version. Also, any risk of Netlink writes failing has been eliminated, because that’s now
offloaded to a different thread entirely.
Debrief: It’s not great that we created a new linux pthread for the consumer of the samples.
VPP has an elaborate thread management system, and collaborative multitasking in its threading
model, which adds introspection like clock counters, names, show runtime, show threads and so
on. I can’t help but wonder: wouldn’t we just be able to move the spt_process_samples() thread
into a VPP process node instead?
v3bis: SVM FIFO, PSAMPLE process in Main
TL/DR: 9.68Mpps L3, 14.10Mpps L2XC, 14.2 cycles/packet, still with corrupted FIFO queue messages
Neil agrees that there’s no good reason to keep this out of main, and conjures up
[df2dab8d] which rewrites the thread to an
sflow_process_samples() function, using VLIB_REGISTER_NODE to add it to VPP in an idiomatic way.
As a really nice benefit, we can now count how many CPU cycles are spent, in main, each time this
process wakes up and does some work. It’s a widely used pattern in VPP.
Because of the FIFO queue message corruption, Netlink message are failing to send at an alarming
rate, which is causing lots of clib_warning() messages to be spewed on console. I replace those
with a counter of Failed Netlink messages instead, and commit refactor
[6ba4715].
pim@hvn6-lab:~$ grep 'vector rates' v3bis-100-runtime.txt  | grep -v 'in 0'
  vector rates in 1.0976e7, out 1.0976e7, drop 0.0000e0, punt 0.0000e0
  vector rates in 9.6743e6, out 9.6743e6, drop 0.0000e0, punt 0.0000e0
  vector rates in 1.4866e7, out 1.4866e7, drop 0.0000e0, punt 0.0000e0
  vector rates in 1.4052e7, out 1.4052e7, drop 0.0000e0, punt 0.0000e0
pim@hvn6-lab:~$ grep sflow v3bis-100-runtime.txt
Name                   State       Calls    Vectors  Suspends  Clocks    Vectors/Call
sflow-process-samples  any wait        0          0     28052  4.66e4            0.00
sflow                  active    1134102  290330112         0  1.42e1          256.00
sflow                  active    1647240  421693440         0  1.32e1          256.00
pim@hvn6-lab:~$ grep sflow v3bis-100-err.txt
     77945               sflow                        sflow PSAMPLE sent           error
       863               sflow                    sflow PSAMPLE send failed        error
 290376960               sflow                     sflow packets processed         error
   2151184               sflow                      sflow packets sampled          error
 421761024               sflow                     sflow packets processed         error
   3119625               sflow                      sflow packets sampled          error
With this iteration, I make a few observations. Firstly, the sflow-process-samples node shows up
and informs me that, when handling the samples from the worker FIFO queues, the process is using
4660 CPU cycles. Secondly, the replacement of clib_warnign() with the sflow PSAMPLE send failed
counter reduced time from 16.3 to 14.2 cycles on average in the dataplane. Nice.
Debrief: A sad conclusion: of the 5.2M samples taken, only 77k make it through to Netlink. All
these send failures and corrupt packets are really messing things up. So while the provided FIFO
implementation in svm/fifo_segment.h is idiomatic, it is also much more complex than we thought,
and we’re fearing that it may not be safe to read from another thread.
v4: Custom lockless FIFO, PSAMPLE process in Main
TL/DR: 9.56Mpps L3, 13.69Mpps L2XC, 15.6 cycles/packet, corruption fixed!
After reading around a bit in DPDK’s
[kni_fifo], Neil produces a gem of a
commit in
[42bbb64],
where he introduces a tiny multiple-writer, single-consumer FIFO with two simple functions:
sflow_fifo_enqueue() to be called in the workers, and sflow_fifo_dequeue() to be called in the
main thread’s sflow-process-samples process. He then makes this thread-safe by doing what I
consider black magic, in commit
[dd8af17],
which makes use of clib_atomic_load_acq_n() and clib_atomic_store_rel_n() macros from VPP’s
vppinfra/atomics.h.
What I really like about this change is that it introduces a FIFO implementation in about twenty lines of code, which means the sampling code path in the dataplane becomes really easy to follow, and will be even faster than it was before. I take it out for a loadtest:
pim@hvn6-lab:~$ grep 'vector rates' v4-100-runtime.txt  | grep -v 'in 0'
  vector rates in 1.0958e7, out 1.0958e7, drop 0.0000e0, punt 0.0000e0
  vector rates in 9.5633e6, out 9.5633e6, drop 0.0000e0, punt 0.0000e0
  vector rates in 1.4849e7, out 1.4849e7, drop 0.0000e0, punt 0.0000e0
  vector rates in 1.3697e7, out 1.3697e7, drop 0.0000e0, punt 0.0000e0
pim@hvn6-lab:~$ grep sflow v4-100-runtime.txt
Name                   State       Calls    Vectors  Suspends  Clocks    Vectors/Call
sflow-process-samples  any wait        0          0     17767  1.52e6            0.00
sflow                  active    1121156  287015936         0  1.56e1          256.00
sflow                  active    1605772  411077632         0  1.53e1          256.00
pim@hvn6-lab:~$ grep sflow v4-100-err.txt
   3553600               sflow                        sflow PSAMPLE sent           error
 287101184               sflow                     sflow packets processed         error
   2127024               sflow                      sflow packets sampled          error
    350224               sflow                      sflow packets dropped          error
 411199744               sflow                     sflow packets processed         error
   3043693               sflow                      sflow packets sampled          error
   1266893               sflow                      sflow packets dropped          error
This is starting to be a very nice implementation! With this iteration of the plugin, all the corruption is gone, there is a slight regression (because we’re now actually sending the messages). With the v3bis variant, only a tiny fraction of the samples made it through to netlink. With this v4 variant, I can see 2127024 + 3043693 packets sampled, but due to a carefully chosen FIFO depth of 4, the workers will drop samples so as not to overload the main process that is trying to write them out. At this unnatural rate of 1:100, I can see that of the 2127024 samples taken, 350224 are prematurely dropped (because the FIFO queue is full). This is a perfect defense in depth!
Doing the math, both workers can enqueue 1776800 samples in 30 seconds, which is 59k/s per interface. I can also see that the second interface, which is doing L2XC and hits a much larger packets/sec throughput, is dropping more samples because it receives an equal amount of time from main reading samples from its queue. In other words: in an overload scenario, one interface cannot crowd out another. Slick.
Finally, completing my math, each worker has enqueued 1776800 samples to their FIFOs, and I see that
main has dequeued exactly 2x1776800 = 3553600 samples, all successfully written to Netlink, so
the sflow PSAMPLE send failed counter remains zero.
Debrief: In the mean time, Neil has been working on the host-sflow daemon changes to pick up
these netlink messages. There’s also a bit of work to do with retrieving the packet and byte
counters of the VPP interfaces, so he is creating a module in host-sflow that can consume some
messages from VPP. He will call this mod_vpp, and he mails a screenshot of his work in progress.
I’ll discuss the end-to-end changes with hsflowd in a followup article, and focus my efforts here
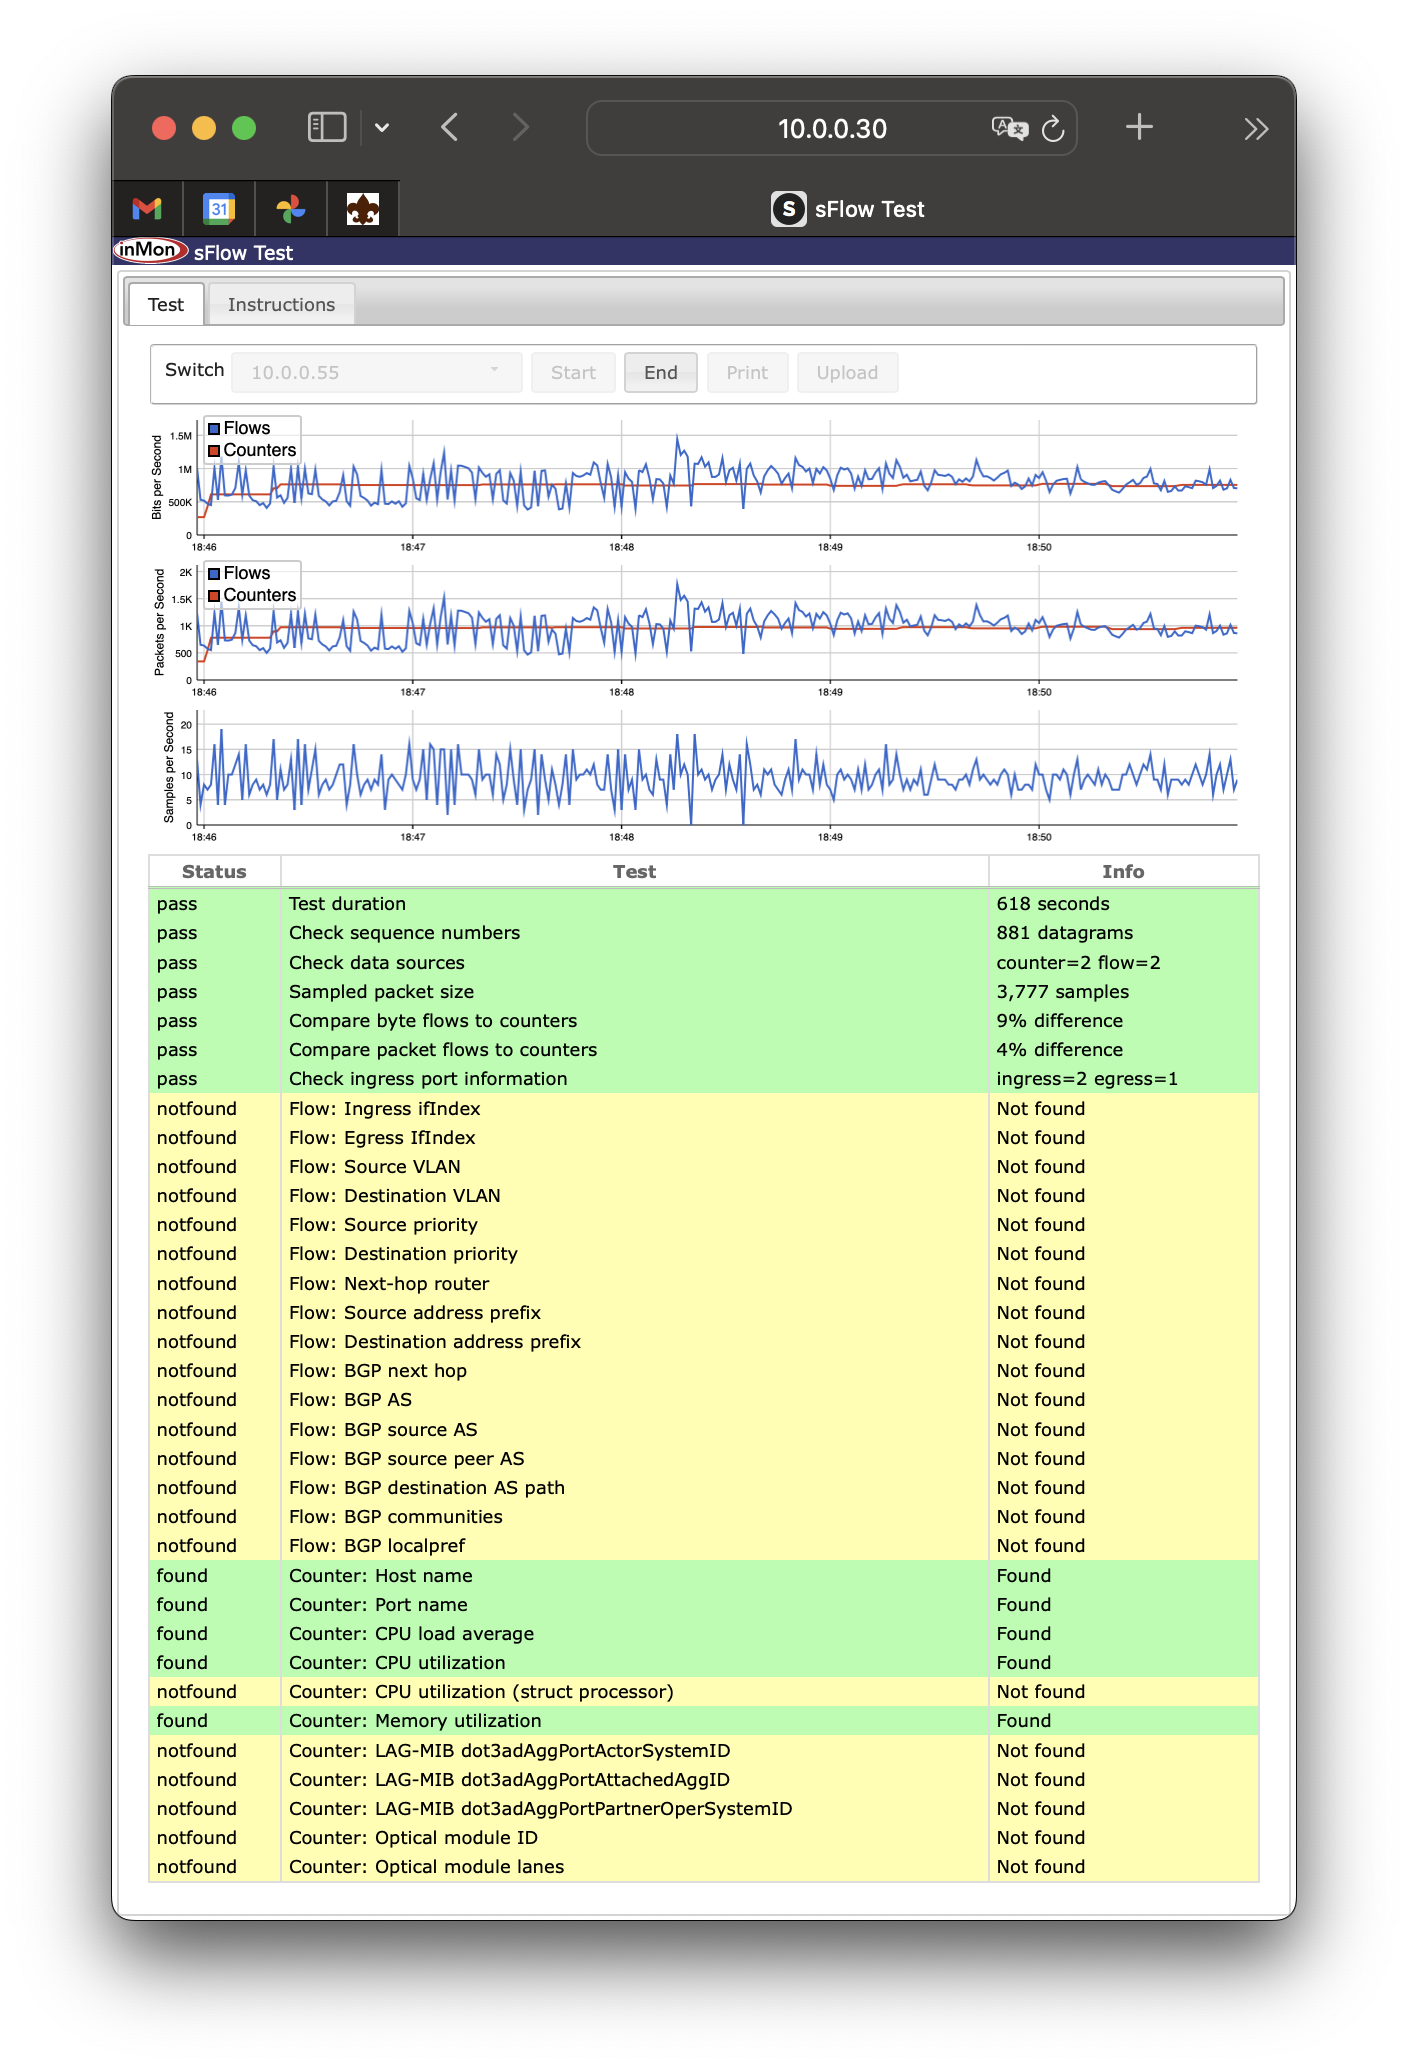
on documenting the VPP parts only. But, as a teaser, here’s a screenshot of a validated
sflow-tool output of a VPP instance using our sFlow plugin and his pending host-sflow changes
to integrate the rest of the business logic outside of the VPP dataplane, where it’s arguably
expensive to make mistakes.
Neil admits to an itch that he has been meaning to scratch all this time. In VPP’s
plugins/sflow/node.c, we insert the node between device-input and ethernet-input. Here, really
most of the time the plugin is just shoveling the ethernet packets through to ethernet-input. To
make use of some CPU instruction cache affinity, the loop that does this shovelling can do it one
packet at a time, two packets at a time, or even four packets at a time. Although the code is super
repetitive and somewhat ugly, it does actually speed up processing in terms of CPU cycles spent per
packet, if you shovel four of them at a time.
v5: Quad Bucket Brigade in worker
TL/DR: 9.68Mpps L3, 14.0Mpps L2XC, 11 CPU cycles/packet, 1.28e5 CPU cycles in main
Neil calls this the Quad Bucket Brigade, and one last finishing touch is to move from his default
2-packet to a 4-packet shoveling. In commit
[285d8a0], he
extends a common pattern in VPP dataplane nodes, each time the node iterates, it’ll pre-fetch now up
to eight packets (p0-p7) if the vector is long enough, and handle them four at a time (b0-b3).
He also adds a few compiler hints with branch prediction: almost no packets will have a trace
enabled, so he can use PREDICT_FALSE() macros to allow the compiler to further optimize the code.
I find reading the dataplane code, that it is incredibly ugly. But it’s the price to pay for ultra
fast throughput. But how do we see the effect? My low-tech proposal is to enable sampling at a very
high rate, say 1:10'000'000, so that the code path that grabs and enqueues the sample into the FIFO
is almost never called. Then, what’s left for the sFlow dataplane node, really is to shovel the
packets from device-input into ethernet-input.
To measure the relative improvement, I do one test with, and one without commit [285d8a09].
pim@hvn6-lab:~$ grep 'vector rates' v5-10M-runtime.txt  | grep -v 'in 0'
  vector rates in 1.0981e7, out 1.0981e7, drop 0.0000e0, punt 0.0000e0
  vector rates in 9.8806e6, out 9.8806e6, drop 0.0000e0, punt 0.0000e0
  vector rates in 1.4849e7, out 1.4849e7, drop 0.0000e0, punt 0.0000e0
  vector rates in 1.4328e7, out 1.4328e7, drop 0.0000e0, punt 0.0000e0
pim@hvn6-lab:~$ grep sflow v5-10M-runtime.txt
Name                   State       Calls    Vectors  Suspends  Clocks    Vectors/Call
sflow-process-samples  any wait        0          0     28467  9.36e3            0.00
sflow                  active    1158325  296531200         0  1.09e1          256.00
sflow                  active    1679742  430013952         0  1.11e1          256.00

pim@hvn6-lab:~$ grep 'vector rates' v5-noquadbrigade-10M-runtime.txt  | grep -v in\ 0
  vector rates in 1.0959e7, out 1.0959e7, drop 0.0000e0, punt 0.0000e0
  vector rates in 9.7046e6, out 9.7046e6, drop 0.0000e0, punt 0.0000e0
  vector rates in 1.4849e7, out 1.4849e7, drop 0.0000e0, punt 0.0000e0
  vector rates in 1.4008e7, out 1.4008e7, drop 0.0000e0, punt 0.0000e0
pim@hvn6-lab:~$ grep sflow v5-noquadbrigade-10M-runtime.txt
Name                   State       Calls    Vectors  Suspends  Clocks    Vectors/Call
sflow-process-samples  any wait        0          0     28462  9.57e3            0.00
sflow                  active    1137571  291218176         0  1.26e1          256.00
sflow                  active    1641991  420349696         0  1.20e1          256.00
Would you look at that, this optimization actually works as advertised! There is a meaningful progression from v5-noquadbrigade (9.70Mpps L3, 14.00Mpps L2XC) to v5 (9.88Mpps L3, 14.32Mpps L2XC). So at the expense of adding 63 lines of code, there is a 2.8% increase in throughput. Quad-Bucket-Brigade, yaay!
I’ll leave you with a beautiful screenshot of the current code at HEAD, as it is sampling 1:100 packets (!) on four interfaces, while forwarding 8x10G of 256 byte packets at line rate. You’ll recall at the beginning of this article I did an acceptance loadtest with sFlow disabled, but this is the exact same result with sFlow enabled:
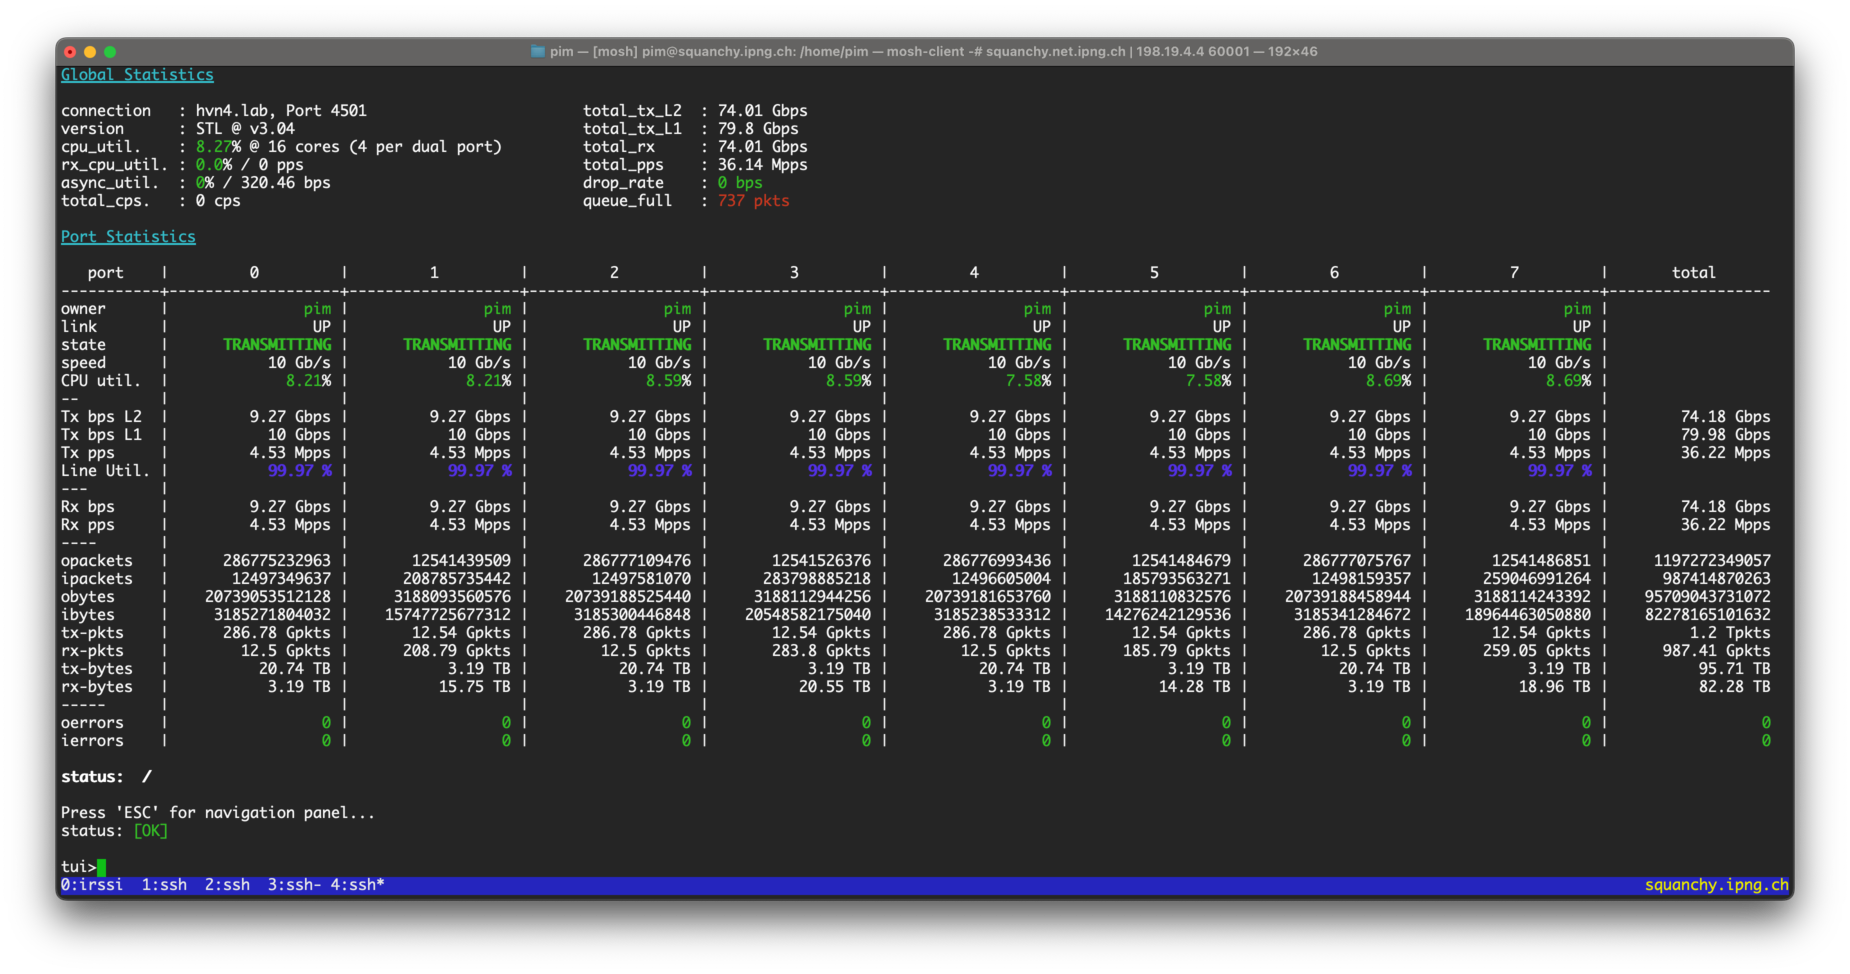
This picture says it all: 79.98 Gbps in, 79.98 Gbps out; 36.22Mpps in, 36.22Mpps out. Also: 176k samples/sec taken from the dataplane, with correct rate limiting due to a per-worker FIFO depth limit, yielding 25k samples/sec sent to Netlink.
What’s Next
Checking in on the three main things we wanted to ensure with the plugin:
- ✅ If
sFlowis not enabled on a given interface, there is no regression on other interfaces. - ✅ If
sFlowis enabled, copying packets costs 11 CPU cycles on average - ✅ If
sFlowtakes a sample, it takes only marginally more CPU time to enqueue.- No sampling gets 9.88Mpps of IPv4 and 14.3Mpps of L2XC throughput,
- 1:1000 sampling reduces to 9.77Mpps of L3 and 14.05Mpps of L2XC throughput,
- and an overly harsh 1:100 reduces to 9.69Mpps and 13.97Mpps only.
The hard part is finished, but we’re not entirely done yet. What’s left is to implement a set of
packet and byte counters, and send this information along with possible Linux CP data (such as the
TAP interface ID in the Linux side), and to add the module for VPP in hsflowd. I’ll write about
that part in a followup article.
Neil has introduced vpp-dev@ to this plugin, and so far there were no objections. But he has pointed
folks to a github out of tree repo, and I may add a Gerrit instead so it becomes part of the
ecosystem. Our work so far is captured in Gerrit [41680],
which ends up being just over 2600 lines all-up. I do think we need to refactor a bit, add some
VPP-specific tidbits like FEATURE.yaml and *.rst documentation, but this should be in reasonable
shape.
Acknowledgements
I’d like to thank Neil McKee from inMon for his dedication to getting things right, including the finer details such as logging, error handling, API specifications, and documentation. He has been a true pleasure to work with and learn from.