Introduction

In the second half of last year, I picked up a project together with Neil McKee of
[inMon], the care takers of [sFlow]: an industry standard
technology for monitoring high speed networks. sFlow gives complete visibility into the
use of networks enabling performance optimization, accounting/billing for usage, and defense against
security threats.
The open source software dataplane [VPP] is a perfect match for sampling, as it
forwards packets at very high rates using underlying libraries like [DPDK] and
[RDMA]. A clever design choice in the
so called Host sFlow Daemon [host-sflow], which allows for
a small portion of code to grab the samples, for example in a merchant silicon ASIC or FPGA, but
also in the VPP software dataplane. The agent then transmits these samples using a Linux kernel
feature called [PSAMPLE].
This greatly reduces the complexity of code to be implemented in the forwarding path, while at the
same time bringing consistency to the sFlow delivery pipeline by (re)using the hsflowd business
logic for the more complex state keeping, packet marshalling and transmission from the Agent to a
central Collector.
In this third article, I wanted to spend some time discussing how samples make their way out of the VPP dataplane, and into higher level tools.
Recap: sFlow
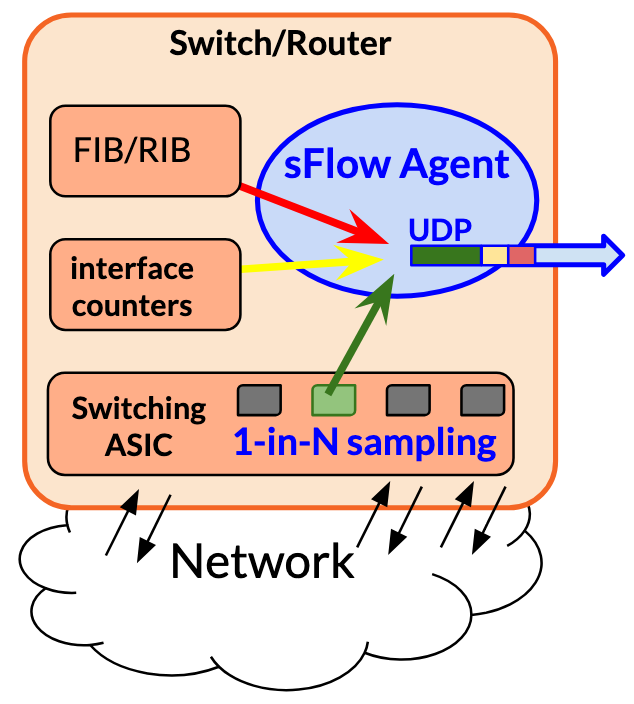
sFlow describes a method for Monitoring Traffic in Switched/Routed Networks, originally described in [RFC3176]. The current specification is version 5 and is homed on the sFlow.org website [ref]. Typically, a Switching ASIC in the dataplane (seen at the bottom of the diagram to the left) is asked to copy 1-in-N packets to local sFlow Agent.
Sampling: The agent will copy the first N bytes (typically 128) of the packet into a sample. As
the ASIC knows which interface the packet was received on, the inIfIndex will be added. After a
routing decision is made, the nexthop and its L2 address and interface become known. The ASIC might
annotate the sample with this outIfIndex and DstMAC metadata as well.
Drop Monitoring: There’s one rather clever insight that sFlow gives: what if the packet was not routed or switched, but rather discarded? For this, sFlow is able to describe the reason for the drop. For example, the ASIC receive queue could have been overfull, or it did not find a destination to forward the packet to (no FIB entry), perhaps it was instructed by an ACL to drop the packet or maybe even tried to transmit the packet but the physical datalink layer had to abandon the transmission for whatever reason (link down, TX queue full, link saturation, and so on). It’s hard to overstate how important it is to have this so-called drop monitoring, as operators often spend hours and hours figuring out why packets are lost their network or datacenter switching fabric.
Metadata: The agent may have other metadata as well, such as which prefix was the source and destination of the packet, what additional RIB information is available (AS path, BGP communities, and so on). This may be added to the sample record as well.
Counters: Since sFlow is sampling 1:N packets, the system can estimate total traffic in a reasonably accurate way. Peter and Sonia wrote a succint [paper] about the math, so I won’t get into that here. Mostly because I am but a software engineer, not a statistician… :) However, I will say this: if a fraction of the traffic is sampled but the Agent knows how many bytes and packets were forwarded in total, it can provide an overview with a quantifiable accuracy. This is why the Agent will periodically get the interface counters from the ASIC.
Collector: One or more samples can be concatenated into UDP messages that go from the sFlow Agent to a central sFlow Collector. The heavy lifting in analysis is done upstream from the switch or router, which is great for performance. Many thousands or even tens of thousands of agents can forward their samples and interface counters to a single central collector, which in turn can be used to draw up a near real time picture of the state of traffic through even the largest of ISP networks or datacenter switch fabrics.
In sFlow parlance [VPP] and its companion
[hsflowd] together form an Agent (it sends the UDP packets
over the network), and for example the commandline tool sflowtool could be a Collector (it
receives the UDP packets).
Recap: sFlow in VPP
First, I have some pretty good news to report - our work on this plugin was [merged] and will be included in the VPP 25.02 release in a few weeks! Last weekend, I gave a lightning talk at [FOSDEM] in Brussels, Belgium, and caught up with a lot of community members and network- and software engineers. I had a great time.
In trying to keep the amount of code as small as possible, and therefore the probability of bugs that might impact VPP’s dataplane stability low, the architecture of the end to end solution consists of three distinct parts, each with their own risk and performance profile:
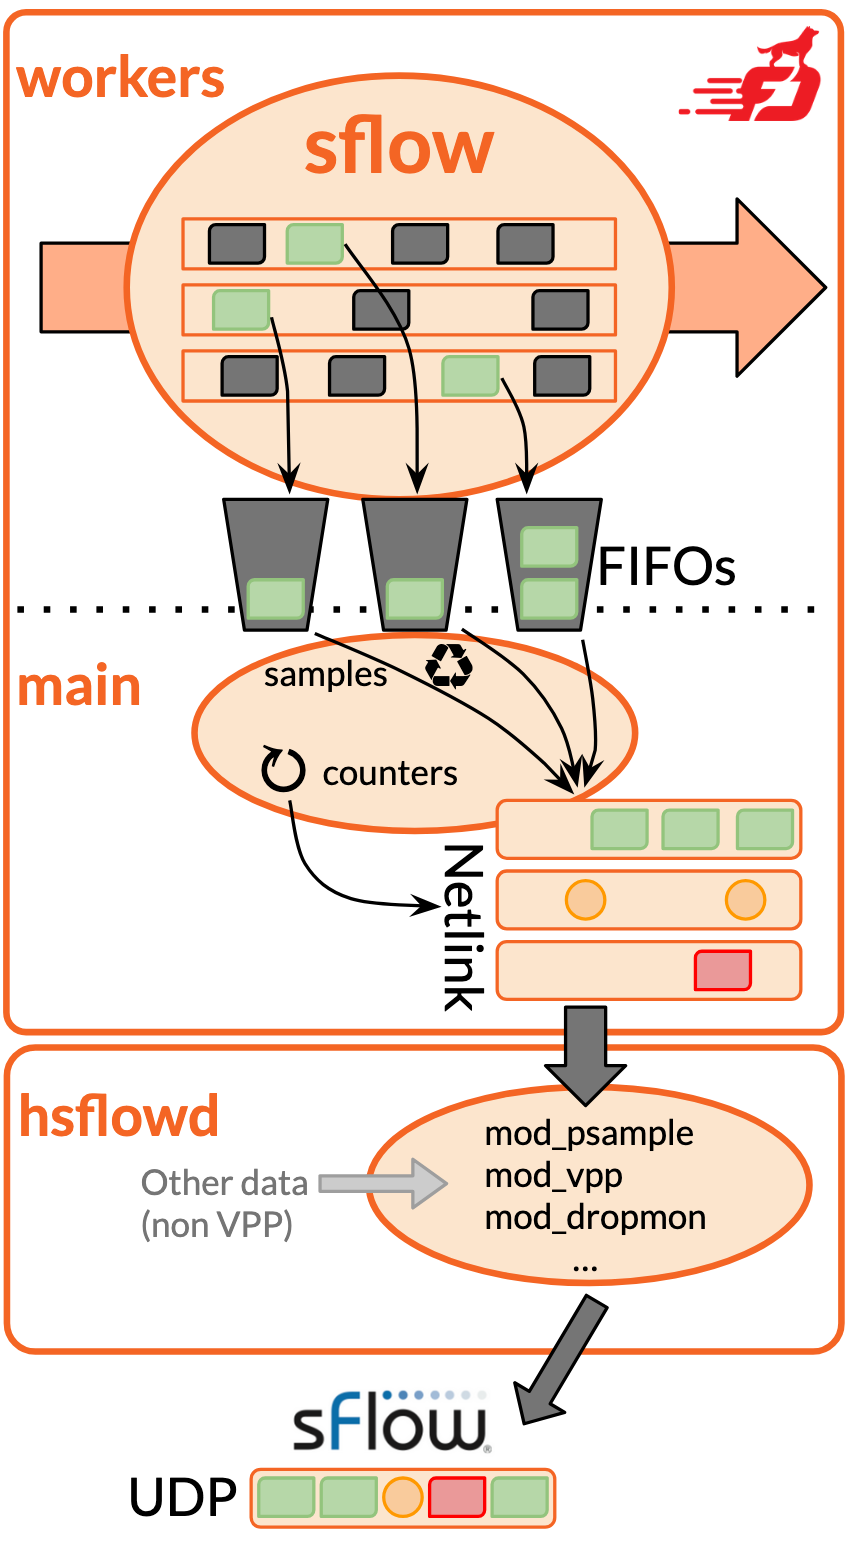
1. sFlow worker node: Its job is to do what the ASIC does in the hardware case. As VPP moves
packets from device-input to the ethernet-input nodes in its forwarding graph, the sFlow plugin
will inspect 1-in-N, taking a sample for further processing. Here, we don’t try to be clever, simply
copy the inIfIndex and the first bytes of the ethernet frame, and append them to a
[FIFO] queue. If too many samples
arrive, samples are dropped at the tail, and a counter incremented. This way, I can tell when the
dataplane is congested. Bounded FIFOs also provide fairness: it allows for each VPP worker thread to
get their fair share of samples into the Agent’s hands.
2. sFlow main process: There’s a function running on the main thread, which shifts further processing time away from the dataplane. This sflow-process does two things. Firstly, it consumes samples from the per-worker FIFO queues (both forwarded packets in green, and dropped ones in red). Secondly, it keeps track of time and every few seconds (20 by default, but this is configurable), it’ll grab all interface counters from those interfaces for which I have sFlow turned on. VPP produces Netlink messages and sends them to the kernel.
3. Host sFlow daemon: The third component is external to VPP: hsflowd subscribes to the Netlink
messages. It goes without saying that hsflowd is a battle-hardened implementation running on
hundreds of different silicon and software defined networking stacks. The PSAMPLE stuff is easy,
this module already exists. But Neil implemented a mod_vpp which can grab interface names and their
ifIndex, and counter statistics. VPP emits this data as Netlink USERSOCK messages alongside
the PSAMPLEs.
By the way, I’ve written about Netlink before when discussing the [Linux Control Plane] plugin. It’s a mechanism for programs running in userspace to share
information with the kernel. In the Linux kernel, packets can be sampled as well, and sent from
kernel to userspace using a PSAMPLE Netlink channel. However, the pattern is that of a message
producer/subscriber relationship and nothing precludes one userspace process (vpp) to be the
producer while another userspace process (hsflowd) acts as the consumer!
Assuming the sFlow plugin in VPP produces samples and counters properly, hsflowd will do the rest,
giving correctness and upstream interoperability pretty much for free. That’s slick!
VPP: sFlow Configuration
The solution that I offer is based on two moving parts. First, the VPP plugin configuration, which turns on sampling at a given rate on physical devices, also known as hardware-interfaces. Second, the open source component [host-sflow] can be configured as of release v2.11-5 [ref].
I will show how to configure VPP in three ways:
1. VPP Configuration via CLI
pim@vpp0-0:~$ vppctl
vpp0-0# sflow sampling-rate 100
vpp0-0# sflow polling-interval 10
vpp0-0# sflow header-bytes 128
vpp0-0# sflow enable GigabitEthernet10/0/0
vpp0-0# sflow enable GigabitEthernet10/0/0 disable
vpp0-0# sflow enable GigabitEthernet10/0/2
vpp0-0# sflow enable GigabitEthernet10/0/3
The first three commands set the global defaults - in my case I’m going to be sampling at 1:100 which is an unusually high rate. A production setup may take 1-in-linkspeed-in-megabits so for a 1Gbps device 1:1'000 is appropriate. For 100GE, something between 1:10'000 and 1:100'000 is more appropriate, depending on link load. The second command sets the interface stats polling interval. The default is to gather these statistics every 20 seconds, but I set it to 10s here.
Next, I tell the plugin how many bytes of the sampled ethernet frame should be taken. Common values are 64 and 128 but it doesn’t have to be a power of two. I want enough data to see the headers, like MPLS label(s), Dot1Q tag(s), IP header and TCP/UDP/ICMP header, but the contents of the payload are rarely interesting for statistics purposes.
Finally, I can turn on the sFlow plugin on an interface with the sflow enable-disable CLI. In VPP,
an idiomatic way to turn on and off things is to have an enabler/disabler. It feels a bit clunky
maybe to write sflow enable $iface disable but it makes more logical sends if you parse that as
“enable-disable” with the default being the “enable” operation, and the alternate being the
“disable” operation.
2. VPP Configuration via API
I implemented a few API methods for the most common operations. Here’s a snippet that obtains the same config as what I typed on the CLI above, but using these Python API calls:
from vpp_papi import VPPApiClient, VPPApiJSONFiles
import sys

vpp_api_dir = VPPApiJSONFiles.find_api_dir([])
vpp_api_files = VPPApiJSONFiles.find_api_files(api_dir=vpp_api_dir)
vpp = VPPApiClient(apifiles=vpp_api_files, server_address="/run/vpp/api.sock")
vpp.connect("sflow-api-client")
print(vpp.api.show_version().version)
# Output: 25.06-rc0~14-g9b1c16039

vpp.api.sflow_sampling_rate_set(sampling_N=100)
print(vpp.api.sflow_sampling_rate_get())
# Output: sflow_sampling_rate_get_reply(_0=655, context=3, sampling_N=100)

vpp.api.sflow_polling_interval_set(polling_S=10)
print(vpp.api.sflow_polling_interval_get())
# Output: sflow_polling_interval_get_reply(_0=661, context=5, polling_S=10)

vpp.api.sflow_header_bytes_set(header_B=128)
print(vpp.api.sflow_header_bytes_get())
# Output: sflow_header_bytes_get_reply(_0=665, context=7, header_B=128)

vpp.api.sflow_enable_disable(hw_if_index=1, enable_disable=True)
vpp.api.sflow_enable_disable(hw_if_index=2, enable_disable=True)
print(vpp.api.sflow_interface_dump())
# Output: [ sflow_interface_details(_0=667, context=8, hw_if_index=1),
#           sflow_interface_details(_0=667, context=8, hw_if_index=2) ]

print(vpp.api.sflow_interface_dump(hw_if_index=2))
# Output: [ sflow_interface_details(_0=667, context=9, hw_if_index=2) ]

print(vpp.api.sflow_interface_dump(hw_if_index=1234)) ## Invalid hw_if_index
# Output: []

vpp.api.sflow_enable_disable(hw_if_index=1, enable_disable=False)
print(vpp.api.sflow_interface_dump())
# Output: [ sflow_interface_details(_0=667, context=10, hw_if_index=2) ]
This short program toys around a bit with the sFlow API. I first set the sampling to 1:100 and get the current value. Then I set the polling interval to 10s and retrieve the current value again. Finally, I set the header bytes to 128, and retrieve the value again.
Enabling and disabling sFlow on interfaces shows the idiom I mentioned before - the API being an
*_enable_disable() call of sorts, and typically taking a boolean argument if the operator wants to
enable (the default), or disable sFlow on the interface. Getting the list of enabled interfaces can
be done with the sflow_interface_dump() call, which returns a list of sflow_interface_details
messages.
I demonstrated VPP’s Python API and how it works in a fair amount of detail in a [previous article], in case this type of stuff interests you.
3. VPPCfg YAML Configuration
Writing on the CLI and calling the API is good and all, but many users of VPP have noticed that it does not have any form of configuration persistence and that’s deliberate. VPP’s goal is to be a programmable dataplane, and explicitly has left the programming and configuration as an exercise for integrators. I have written a Python project that takes a YAML file as input and uses it to configure (and reconfigure, on the fly) the dataplane automatically, called [VPPcfg]. Previously, I wrote some implementation thoughts on its [datamodel] and its [operations] so I won’t repeat that here. Instead, I will just show the configuration:
pim@vpp0-0:~$ cat << EOF > vppcfg.yaml
interfaces:
  GigabitEthernet10/0/0:
    sflow: true
  GigabitEthernet10/0/1:
    sflow: true
  GigabitEthernet10/0/2:
    sflow: true
  GigabitEthernet10/0/3:
    sflow: true

sflow:
  sampling-rate: 100
  polling-interval: 10
  header-bytes: 128
EOF
pim@vpp0-0:~$ vppcfg plan -c vppcfg.yaml -o /etc/vpp/config/vppcfg.vpp
[INFO    ] root.main: Loading configfile vppcfg.yaml
[INFO    ] vppcfg.config.valid_config: Configuration validated successfully
[INFO    ] root.main: Configuration is valid
[INFO    ] vppcfg.reconciler.write: Wrote 13 lines to /etc/vpp/config/vppcfg.vpp
[INFO    ] root.main: Planning succeeded
pim@vpp0-0:~$ vppctl exec /etc/vpp/config/vppcfg.vpp
The nifty thing about vppcfg is that if I were to change, say, the sampling-rate (setting it to
1000) and disable sFlow from an interface, say Gi10/0/0, I can re-run the vppcfg plan and vppcfg apply stages and the VPP dataplane will be reprogrammed to reflect the newly declared configuration.
hsflowd: Configuration
When sFlow is enabled, VPP will start to emit Netlink messages of type PSAMPLE with packet samples
and of type USERSOCK with the custom messages containing interface names and counters. These latter
custom messages have to be decoded, which is done by the mod_vpp module in hsflowd, starting
from release v2.11-5 [ref].
Here’s a minimalist configuration:
pim@vpp0-0:~$ cat /etc/hsflowd.conf
sflow {
  collector { ip=127.0.0.1 udpport=16343 }
  collector { ip=192.0.2.1 namespace=dataplane }
  psample { group=1 }
  vpp { osIndex=off }
}

There are two important details that can be confusing at first:
1. kernel network namespaces
2. interface index namespaces
hsflowd: Network namespace
Network namespaces virtualize Linux’s network stack. Upon creation, a network namespace contains only
a loopback interface, and subsequently interfaces can be moved between namespaces. Each network
namespace will have its own set of IP addresses, its own routing table, socket listing, connection
tracking table, firewall, and other network-related resources. When started by systemd, hsflowd
and VPP will normally both run in the default network namespace.
Given this, I can conclude that when the sFlow plugin opens a Netlink channel, it will
naturally do this in the network namespace that its VPP process is running in (the default
namespace, normally). It is therefore important that the recipient of these Netlink messages,
notably hsflowd runs in ths same namespace as VPP. It’s totally fine to run them together in
a different namespace (eg. a container in Kubernetes or Docker), as long as they can see each other.
It might pose a problem if the network connectivity lives in a different namespace than the default one. One common example (that I heavily rely on at IPng!) is to create Linux Control Plane interface pairs, LIPs, in a dataplane namespace. The main reason for doing this is to allow something like FRR or Bird to completely govern the routing table in the kernel and keep it in-sync with the FIB in VPP. In such a dataplane network namespace, typically every interface is owned by VPP.
Luckily, hsflowd can attach to one (default) namespace to get the PSAMPLEs, but create a socket in
a different (dataplane) namespace to send packets to a collector. This explains the second
collector entry in the config-file above. Here, hsflowd will send UDP packets to 192.0.2.1:6343
from within the (VPP) dataplane namespace, and to 127.0.0.1:16343 in the default namespace.
hsflowd: osIndex
I hope the previous section made some sense, because this one will be a tad more esoteric. When
creating a network namespace, each interface will get its own uint32 interface index that identifies
it, and such an ID is typically called an ifIndex. It’s important to note that the same number can
(and will!) occur multiple times, once for each namespace. Let me give you an example:
pim@summer:~$ ip link
1: lo: <LOOPBACK,UP,LOWER_UP> mtu 65536 qdisc noqueue state UNKNOWN ...
    link/loopback 00:00:00:00:00:00 brd 00:00:00:00:00:00
2: eno1: <BROADCAST,MULTICAST,UP,LOWER_UP> mtu 9000 qdisc mq master ipng-sl state UP ...
    link/ether 00:22:19:6a:46:2e brd ff:ff:ff:ff:ff:ff
    altname enp1s0f0
3: eno2: <NO-CARRIER,BROADCAST,MULTICAST,UP> mtu 900 qdisc mq master ipng-sl state DOWN ...
    link/ether 00:22:19:6a:46:30 brd ff:ff:ff:ff:ff:ff
    altname enp1s0f1

pim@summer:~$ ip netns exec dataplane ip link
1: lo: <LOOPBACK,UP,LOWER_UP> mtu 65536 qdisc noqueue state UNKNOWN ...
    link/loopback 00:00:00:00:00:00 brd 00:00:00:00:00:00
2: loop0: <BROADCAST,MULTICAST,UP,LOWER_UP> mtu 9216 qdisc mq state UP ...
    link/ether de:ad:00:00:00:00 brd ff:ff:ff:ff:ff:ff
3: xe1-0: <BROADCAST,MULTICAST,UP,LOWER_UP> mtu 9216 qdisc mq state UP ...
    link/ether 00:1b:21:bd:c7:18 brd ff:ff:ff:ff:ff:ff
I want to draw your attention to the number at the beginning of the line. In the default
namespace, ifIndex=3 corresponds to ifName=eno2 (which has no link, it’s marked DOWN). But in
the dataplane namespace, that index corresponds to a completely different interface called
ifName=xe1-0 (which is link UP).
Now, let me show you the interfaces in VPP:
pim@summer:~$ vppctl show int | grep Gigabit | egrep 'Name|loop0|tap0|Gigabit'
              Name               Idx    State  MTU (L3/IP4/IP6/MPLS)
GigabitEthernet4/0/0              1      up          9000/0/0/0
GigabitEthernet4/0/1              2     down         9000/0/0/0
GigabitEthernet4/0/2              3     down         9000/0/0/0
GigabitEthernet4/0/3              4     down         9000/0/0/0
TenGigabitEthernet5/0/0           5      up          9216/0/0/0
TenGigabitEthernet5/0/1           6      up          9216/0/0/0
loop0                             7      up          9216/0/0/0
tap0                              19     up          9216/0/0/0
Here, I want you to look at the second column Idx, which shows what VPP calls the sw_if_index
(the software interface index, as opposed to hardware index). Here, ifIndex=3 corresponds to
ifName=GigabitEthernet4/0/2, which is neither eno2 nor xe1-0. Oh my, yet another namespace!
It turns out that there are three (relevant) types of namespaces at play here:
- Linux network namespace; here using
dataplaneanddefaulteach with their own unique (and overlapping) numbering. - VPP hardware interface namespace, also called PHYs (for physical interfaces). When VPP first attaches to or creates network interfaces like the ones from DPDK or RDMA, these will create an hw_if_index in a list.
- VPP software interface namespace. All interfaces (including hardware ones!) will
receive a sw_if_index in VPP. A good example is sub-interfaces: if I create a sub-int on
GigabitEthernet4/0/2, it will NOT get a hardware index, but it will get the next available
software index (in this example,
sw_if_index=7).
In Linux CP, I can see a mapping from one to the other, just look at this:
pim@summer:~$ vppctl show lcp
lcp default netns dataplane
lcp lcp-auto-subint off
lcp lcp-sync on
lcp lcp-sync-unnumbered on
itf-pair: [0] loop0 tap0 loop0 2 type tap netns dataplane
itf-pair: [1] TenGigabitEthernet5/0/0 tap1 xe1-0 3 type tap netns dataplane
itf-pair: [2] TenGigabitEthernet5/0/1 tap2 xe1-1 4 type tap netns dataplane
itf-pair: [3] TenGigabitEthernet5/0/0.20 tap1.20 xe1-0.20 5 type tap netns dataplane
Those itf-pair describe our LIPs, and they have the coordinates to three things. 1) The VPP
software interface (VPP ifName=loop0 with sw_if_index=7), which 2) Linux CP will mirror into the
Linux kernel using a TAP device (VPP ifName=tap0 with sw_if_index=19). That TAP has one leg in
VPP (tap0), and another in 3) Linux (with ifName=loop and ifIndex=2 in namespace dataplane).
So the tuple that fully describes a LIP is
{7, 19,'dataplane', 2}
Climbing back out of that rabbit hole, I am now finally ready to explain the feature. When sFlow in VPP takes its sample, it will be doing this on a PHY, that is a given interface with a specific hw_if_index. When it polls the counters, it’ll do it for that specific hw_if_index. It now has a choice: should it share with the world the representation of its namespace, or should it try to be smarter? If LinuxCP is enabled, this interface will likely have a representation in Linux. So the plugin will first resolve the sw_if_index belonging to that PHY, and using that, try to look up a LIP with it. If it finds one, it’ll know both the namespace in which it lives as well as the osIndex in that namespace. If it doesn’t find a LIP, it will at least have the sw_if_index at hand, so it’ll annotate the USERSOCK counter messages with this information instead.
Now, hsflowd has a choice to make: does it share the Linux representation and hide VPP as an
implementation detail? Or does it share the VPP dataplane sw_if_index? There are use cases
relevant to both, so the decision was to let the operator decide, by setting osIndex either on
(use Linux ifIndex) or off (use VPP sw_if_index).
hsflowd: Host Counters
Now that I understand the configuration parts of VPP and hsflowd, I decide to configure everything
but without enabling sFlow on on any interfaces yet in VPP. Once I start the daemon, I can see that
it sends an UDP packet every 30 seconds to the configured collector:
pim@vpp0-0:~$ sudo tcpdump -s 9000 -i lo -n
tcpdump: verbose output suppressed, use -v[v]... for full protocol decode
listening on lo, link-type EN10MB (Ethernet), snapshot length 9000 bytes
15:34:19.695042 IP 127.0.0.1.48753 > 127.0.0.1.6343: sFlowv5,
   IPv4 agent 198.19.5.16, agent-id 100000, length 716
The tcpdump I have on my Debian bookworm machines doesn’t know how to decode the contents of these
sFlow packets. Actually, neither does Wireshark. I’ve attached a file of these mysterious packets
[sflow-host.pcap] in case you want to take a look.
Neil however gives me a tip. A full message decoder and otherwise handy Swiss army knife lives in
[sflowtool].
I can offer this pcap file to sflowtool, or let it just listen on the UDP port directly, and
it’ll tell me what it finds:
pim@vpp0-0:~$ sflowtool -p 6343
startDatagram =================================
datagramSourceIP 127.0.0.1
datagramSize 716
unixSecondsUTC 1739112018
localtime 2025-02-09T15:40:18+0100
datagramVersion 5
agentSubId 100000
agent 198.19.5.16
packetSequenceNo 57
sysUpTime 987398
samplesInPacket 1
startSample ----------------------
sampleType_tag 0:4
sampleType COUNTERSSAMPLE
sampleSequenceNo 33
sourceId 2:1
counterBlock_tag 0:2001
adaptor_0_ifIndex 2
adaptor_0_MACs 1
adaptor_0_MAC_0 525400f00100
counterBlock_tag 0:2010
udpInDatagrams 123904
udpNoPorts 23132459
udpInErrors 0
udpOutDatagrams 46480629
udpRcvbufErrors 0
udpSndbufErrors 0
udpInCsumErrors 0
counterBlock_tag 0:2009
tcpRtoAlgorithm 1
tcpRtoMin 200
tcpRtoMax 120000
tcpMaxConn 4294967295
tcpActiveOpens 0
tcpPassiveOpens 30
tcpAttemptFails 0
tcpEstabResets 0
tcpCurrEstab 1
tcpInSegs 89120
tcpOutSegs 86961
tcpRetransSegs 59
tcpInErrs 0
tcpOutRsts 4
tcpInCsumErrors 0
counterBlock_tag 0:2008
icmpInMsgs 23129314
icmpInErrors 32
icmpInDestUnreachs 0
icmpInTimeExcds 23129282
icmpInParamProbs 0
icmpInSrcQuenchs 0
icmpInRedirects 0
icmpInEchos 0
icmpInEchoReps 32
icmpInTimestamps 0
icmpInAddrMasks 0
icmpInAddrMaskReps 0
icmpOutMsgs 0
icmpOutErrors 0
icmpOutDestUnreachs 23132467
icmpOutTimeExcds 0
icmpOutParamProbs 23132467
icmpOutSrcQuenchs 0
icmpOutRedirects 0
icmpOutEchos 0
icmpOutEchoReps 0
icmpOutTimestamps 0
icmpOutTimestampReps 0
icmpOutAddrMasks 0
icmpOutAddrMaskReps 0
counterBlock_tag 0:2007
ipForwarding 2
ipDefaultTTL 64
ipInReceives 46590552
ipInHdrErrors 0
ipInAddrErrors 0
ipForwDatagrams 0
ipInUnknownProtos 0
ipInDiscards 0
ipInDelivers 46402357
ipOutRequests 69613096
ipOutDiscards 0
ipOutNoRoutes 80
ipReasmTimeout 0
ipReasmReqds 0
ipReasmOKs 0
ipReasmFails 0
ipFragOKs 0
ipFragFails 0
ipFragCreates 0
counterBlock_tag 0:2005
disk_total 6253608960
disk_free 2719039488
disk_partition_max_used 56.52
disk_reads 11512
disk_bytes_read 626214912
disk_read_time 48469
disk_writes 1058955
disk_bytes_written 8924332032
disk_write_time 7954804
counterBlock_tag 0:2004
mem_total 8326963200
mem_free 5063872512
mem_shared 0
mem_buffers 86425600
mem_cached 827752448
swap_total 0
swap_free 0
page_in 306365
page_out 4357584
swap_in 0
swap_out 0
counterBlock_tag 0:2003
cpu_load_one 0.030
cpu_load_five 0.050
cpu_load_fifteen 0.040
cpu_proc_run 1
cpu_proc_total 138
cpu_num 2
cpu_speed 1699
cpu_uptime 1699306
cpu_user 64269210
cpu_nice 1810
cpu_system 34690140
cpu_idle 3234293560
cpu_wio 3568580
cpuintr 0
cpu_sintr 5687680
cpuinterrupts 1596621688
cpu_contexts 3246142972
cpu_steal 329520
cpu_guest 0
cpu_guest_nice 0
counterBlock_tag 0:2006
nio_bytes_in 250283
nio_pkts_in 2931
nio_errs_in 0
nio_drops_in 0
nio_bytes_out 370244
nio_pkts_out 1640
nio_errs_out 0
nio_drops_out 0
counterBlock_tag 0:2000
hostname vpp0-0
UUID ec933791-d6af-7a93-3b8d-aab1a46d6faa
machine_type 3
os_name 2
os_release 6.1.0-26-amd64
endSample   ----------------------
endDatagram   =================================
If you thought: “What an obnoxiously long paste!”, then my slightly RSI-induced mouse-hand might agree with you. But it is really cool to see that every 30 seconds, the collector will receive this form of heartbeat from the agent. There’s a lot of vitalsigns in this packet, including some non-obvious but interesting stats like CPU load, memory, disk use and disk IO, and kernel version information. It’s super dope!
hsflowd: Interface Counters
Next, I’ll enable sFlow in VPP on all four interfaces (Gi10/0/0-Gi10/0/3), set the sampling rate to something very high (1 in 100M), and the interface polling-interval to every 10 seconds. And indeed, every ten seconds or so I get a few packets, which I captured in [sflow-interface.pcap]. Most of the packets contain only one counter record, while some contain more than one (in the PCAP, packet #9 has two). If I update the polling-interval to every second, I can see that most of the packets have all four counters.
Those interface counters, as decoded by sflowtool, look like this:
pim@vpp0-0:~$ sflowtool -r sflow-interface.pcap | \
              awk '/startSample/ { on=1 } { if (on) { print $0 } } /endSample/ { on=0 }'
startSample   ----------------------
sampleType_tag 0:4
sampleType COUNTERSSAMPLE
sampleSequenceNo 745
sourceId 0:3
counterBlock_tag 0:1005
ifName GigabitEthernet10/0/2
counterBlock_tag 0:1
ifIndex 3
networkType 6
ifSpeed 0
ifDirection 1
ifStatus 3
ifInOctets 858282015
ifInUcastPkts 780540
ifInMulticastPkts 0
ifInBroadcastPkts 0
ifInDiscards 0
ifInErrors 0
ifInUnknownProtos 0
ifOutOctets 1246716016
ifOutUcastPkts 975772
ifOutMulticastPkts 0
ifOutBroadcastPkts 0
ifOutDiscards 127
ifOutErrors 28
ifPromiscuousMode 0
endSample   ----------------------
What I find particularly cool about it, is that sFlow provides an automatic mapping between the
ifName=GigabitEthernet10/0/2 (tag 0:1005), together with an object (tag 0:1), which contains the
ifIndex=3, and lots of packet and octet counters both in the ingress and egress direction. This is
super useful for upstream collectors, as they can now find the hostname, agent name and address,
and the correlation between interface names and their indexes. Noice!
hsflowd: Packet Samples
Now it’s time to ratchet up the packet sampling, so I move it from 1:100M to 1:1000, while keeping
the interface polling-interval at 10 seconds and I ask VPP to sample 64 bytes of each packet that it
inspects. On either side of my pet VPP instance, I start an iperf3 run to generate some traffic. I
now see a healthy stream of sflow packets coming in on port 6343. They still contain every 30
seconds or so a host counter, and every 10 seconds a set of interface counters come by, but mostly
these UDP packets are showing me samples. I’ve captured a few minutes of these in
[sflow-all.pcap].
Although Wireshark doesn’t know how to interpret the sFlow counter messages, it does know how to
interpret the sFlow sample messagess, and it reveals one of them like this:
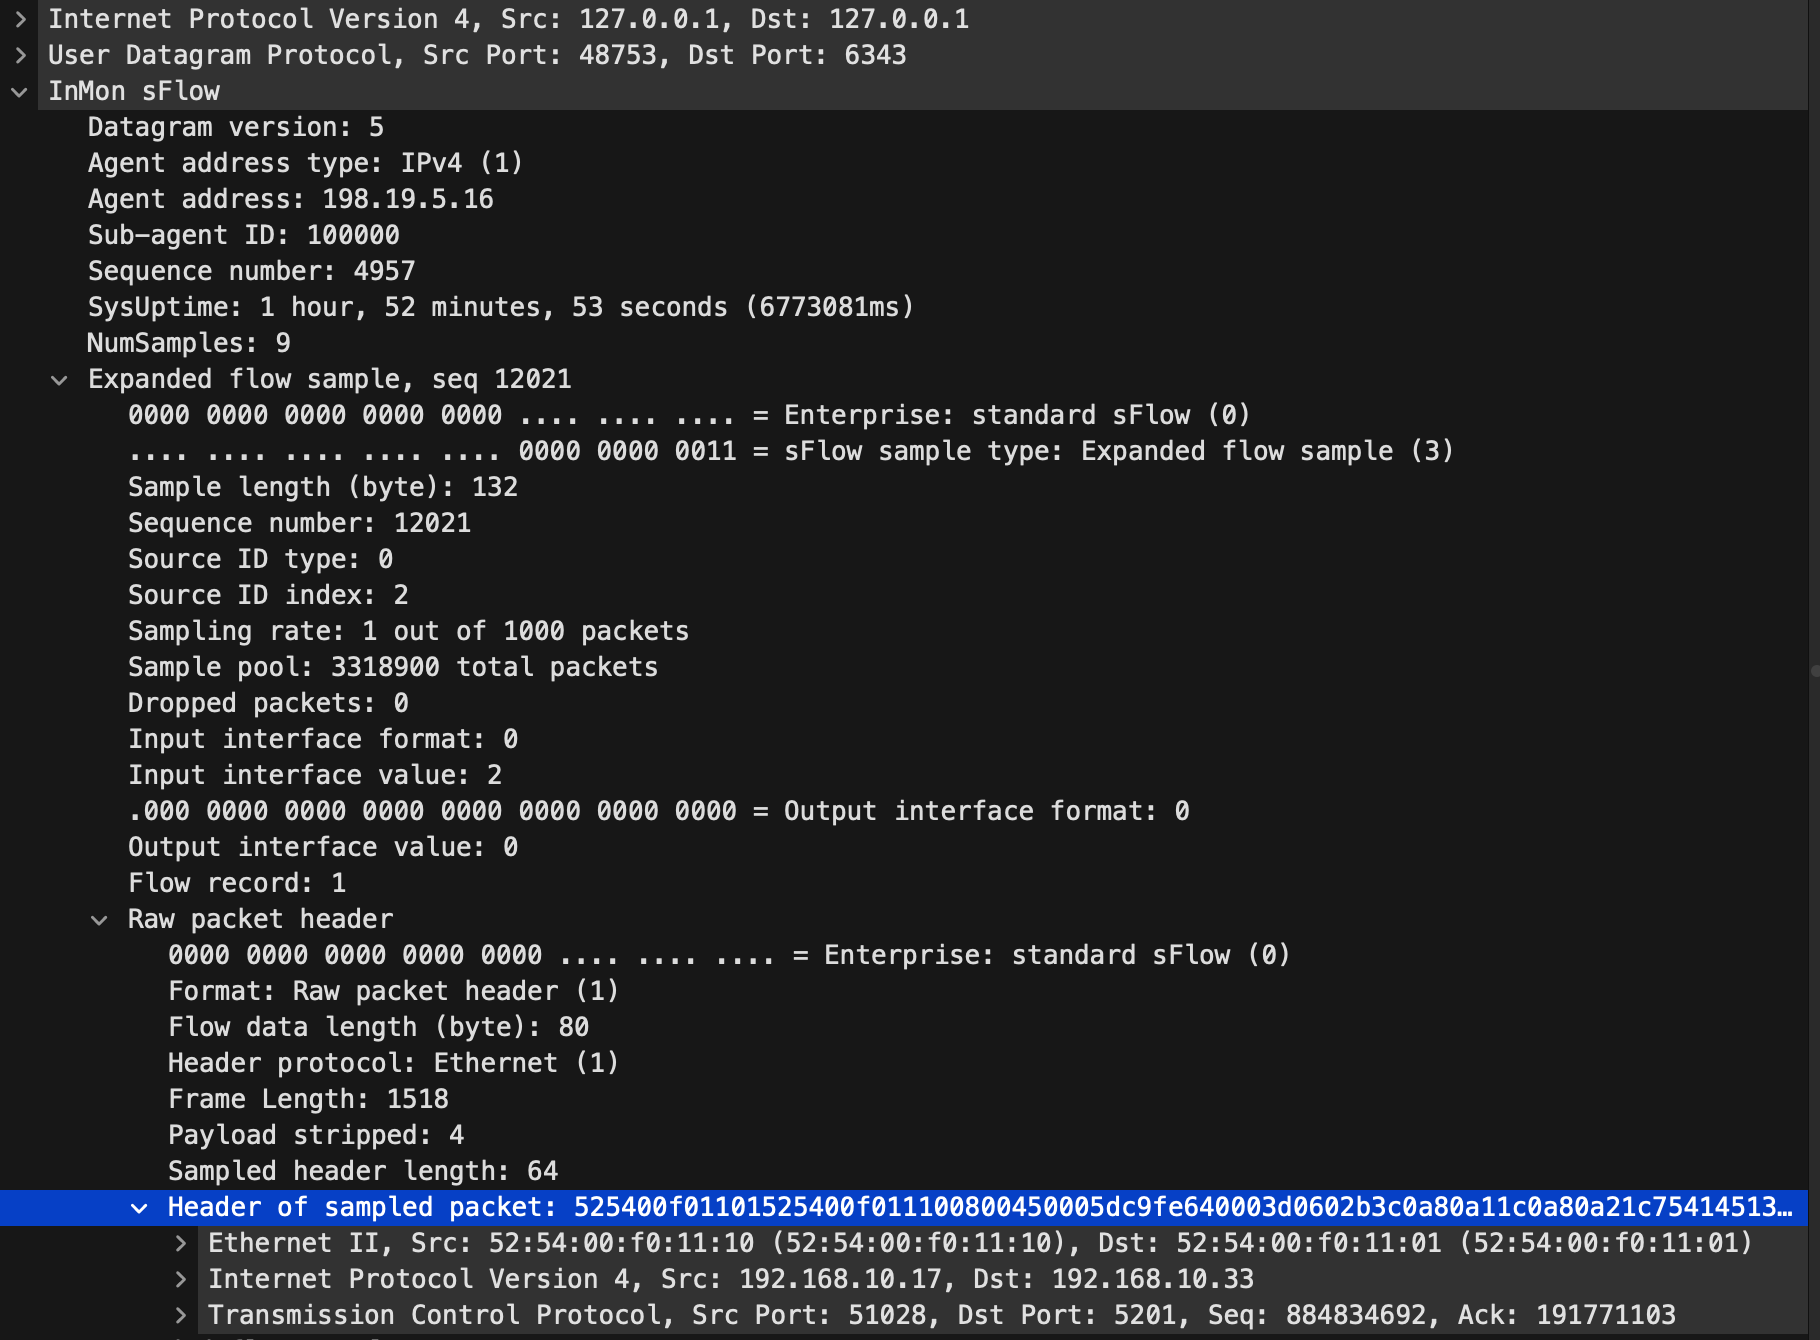
Let me take a look at the picture from top to bottom. First, the outer header (from 127.0.0.1:48753
to 127.0.0.1:6343) is the sFlow agent sending to the collector. The agent identifies itself as
having IPv4 address 198.19.5.16 with ID 100000 and an uptime of 1h52m. Then, it says it’s going to
send 9 samples, the first of which says it’s from ifIndex=2 and at a sampling rate of 1:1000. It
then shows that sample, saying that the frame length is 1518 bytes, and the first 64 bytes of those
are sampled. Finally, the first sampled packet starts at the blue line. It shows the SrcMAC and
DstMAC, and that it was a TCP packet from 192.168.10.17:51028 to 192.168.10.33:5201 - my running
iperf3, booyah!
VPP: sFlow Performance
One question I get a lot about this plugin is: what is the performance impact when using sFlow? I spent a considerable amount of time tinkering with this, and together with Neil bringing the plugin to what we both agree is the most efficient use of CPU. We could have gone a bit further, but that would require somewhat intrusive changes to VPP’s internals and as North of the Border (and the Simpsons!) would say: what we have isn’t just good, it’s good enough!
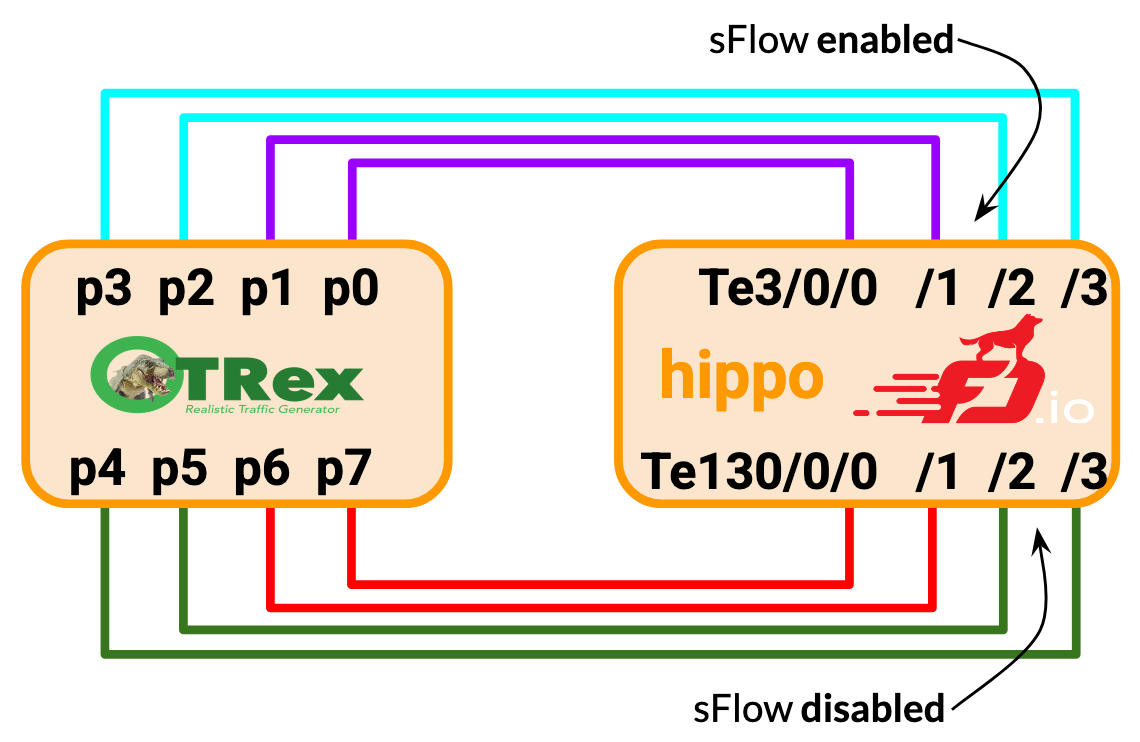
I’ve built a small testbed based on two Dell R730 machines. On the left, I have a Debian machine running Cisco T-Rex using four quad-tengig network cards, the classic Intel i710-DA4. On the right, I have my VPP machine called Hippo (because it’s always hungry for packets), with the same hardware. I’ll build two halves. On the top NIC (Te3/0/0-3 in VPP), I will install IPv4 and MPLS forwarding on the purple circuit, and a simple Layer2 cross connect on the cyan circuit. On all four interfaces, I will enable sFlow. Then, I will mirror this configuration on the bottom NIC (Te130/0/0-3) in the red and green circuits, for which I will leave sFlow turned off.
To help you reproduce my results, and under the assumption that this is your jam, here’s the configuration for all of the kit:
0. Cisco T-Rex
pim@trex:~ $ cat /srv/trex/8x10.yaml
- version: 2
  interfaces: [ '06:00.0', '06:00.1', '83:00.0', '83:00.1', '87:00.0', '87:00.1', '85:00.0', '85:00.1' ]
  port_info:
    - src_mac:  00:1b:21:06:00:00
      dest_mac: 9c:69:b4:61:a1:dc    # Connected to Hippo Te3/0/0, purple
    - src_mac:  00:1b:21:06:00:01
      dest_mac: 9c:69:b4:61:a1:dd    # Connected to Hippo Te3/0/1, purple
    - src_mac:  00:1b:21:83:00:00
      dest_mac: 00:1b:21:83:00:01    # L2XC via Hippo Te3/0/2, cyan
    - src_mac:  00:1b:21:83:00:01
      dest_mac: 00:1b:21:83:00:00    # L2XC via Hippo Te3/0/3, cyan

    - src_mac:  00:1b:21:87:00:00
      dest_mac: 9c:69:b4:61:75:d0    # Connected to Hippo Te130/0/0, red
    - src_mac:  00:1b:21:87:00:01
      dest_mac: 9c:69:b4:61:75:d1    # Connected to Hippo Te130/0/1, red
    - src_mac:  9c:69:b4:85:00:00
      dest_mac: 9c:69:b4:85:00:01    # L2XC via Hippo Te130/0/2, green
    - src_mac:  9c:69:b4:85:00:01
      dest_mac: 9c:69:b4:85:00:00    # L2XC via Hippo Te130/0/3, green
pim@trex:~ $ sudo t-rex-64 -i -c 4 --cfg /srv/trex/8x10.yaml
When constructing the T-Rex configuration, I specifically set the destination MAC address for L3
circuits (the purple and red ones) using Hippo’s interface MAC address, which I can find with
vppctl show hardware-interfaces. This way, T-Rex does not have to ARP for the VPP endpoint. On
L2XC circuits (the cyan and green ones), VPP does not concern itself with the MAC addressing at
all. It puts its interface in promiscuous mode, and simply writes out any ethernet frame received,
directly to the egress interface.
1. IPv4
hippo# set int state TenGigabitEthernet3/0/0 up
hippo# set int state TenGigabitEthernet3/0/1 up
hippo# set int state TenGigabitEthernet130/0/0 up
hippo# set int state TenGigabitEthernet130/0/1 up
hippo# set int ip address TenGigabitEthernet3/0/0 100.64.0.1/31
hippo# set int ip address TenGigabitEthernet3/0/1 100.64.1.1/31
hippo# set int ip address TenGigabitEthernet130/0/0 100.64.4.1/31
hippo# set int ip address TenGigabitEthernet130/0/1 100.64.5.1/31
hippo# ip route add 16.0.0.0/24 via 100.64.0.0
hippo# ip route add 48.0.0.0/24 via 100.64.1.0
hippo# ip route add 16.0.2.0/24 via 100.64.4.0
hippo# ip route add 48.0.2.0/24 via 100.64.5.0
hippo# ip neighbor TenGigabitEthernet3/0/0 100.64.0.0 00:1b:21:06:00:00 static
hippo# ip neighbor TenGigabitEthernet3/0/1 100.64.1.0 00:1b:21:06:00:01 static
hippo# ip neighbor TenGigabitEthernet130/0/0 100.64.4.0 00:1b:21:87:00:00 static
hippo# ip neighbor TenGigabitEthernet130/0/1 100.64.5.0 00:1b:21:87:00:01 static
By the way, one note to this last piece, I’m setting static IPv4 neighbors so that Cisco T-Rex
as well as VPP do not have to use ARP to resolve each other. You’ll see above that the T-Rex
configuration also uses MAC addresses exclusively. Setting the ip neighbor like this allows VPP
to know where to send return traffic.
2. MPLS
hippo# mpls table add 0
hippo# set interface mpls TenGigabitEthernet3/0/0 enable
hippo# set interface mpls TenGigabitEthernet3/0/1 enable
hippo# set interface mpls TenGigabitEthernet130/0/0 enable
hippo# set interface mpls TenGigabitEthernet130/0/1 enable
hippo# mpls local-label add 16 eos via 100.64.1.0 TenGigabitEthernet3/0/1 out-labels 17
hippo# mpls local-label add 17 eos via 100.64.0.0 TenGigabitEthernet3/0/0 out-labels 16
hippo# mpls local-label add 20 eos via 100.64.5.0 TenGigabitEthernet130/0/1 out-labels 21
hippo# mpls local-label add 21 eos via 100.64.4.0 TenGigabitEthernet130/0/0 out-labels 20
Here, the MPLS configuration implements a simple P-router, where incoming MPLS packets with label 16 will be sent back to T-Rex on Te3/0/1 to the specified IPv4 nexthop (for which I already know the MAC address), and with label 16 removed and new label 17 imposed, in other words a SWAP operation.
3. L2XC
hippo# set int state TenGigabitEthernet3/0/2 up
hippo# set int state TenGigabitEthernet3/0/3 up
hippo# set int state TenGigabitEthernet130/0/2 up
hippo# set int state TenGigabitEthernet130/0/3 up
hippo# set int l2 xconnect TenGigabitEthernet3/0/2 TenGigabitEthernet3/0/3
hippo# set int l2 xconnect TenGigabitEthernet3/0/3 TenGigabitEthernet3/0/2
hippo# set int l2 xconnect TenGigabitEthernet130/0/2 TenGigabitEthernet130/0/3
hippo# set int l2 xconnect TenGigabitEthernet130/0/3 TenGigabitEthernet130/0/2
I’ve added a layer2 cross connect as well because it’s computationally very cheap for VPP to receive an L2 (ethernet) datagram, and immediately transmit it on another interface. There’s no FIB lookup and not even an L2 nexthop lookup involved, VPP is just shoveling ethernet packets in-and-out as fast as it can!
Here’s how a loadtest looks like when sending 80Gbps at 192b packets on all eight interfaces:
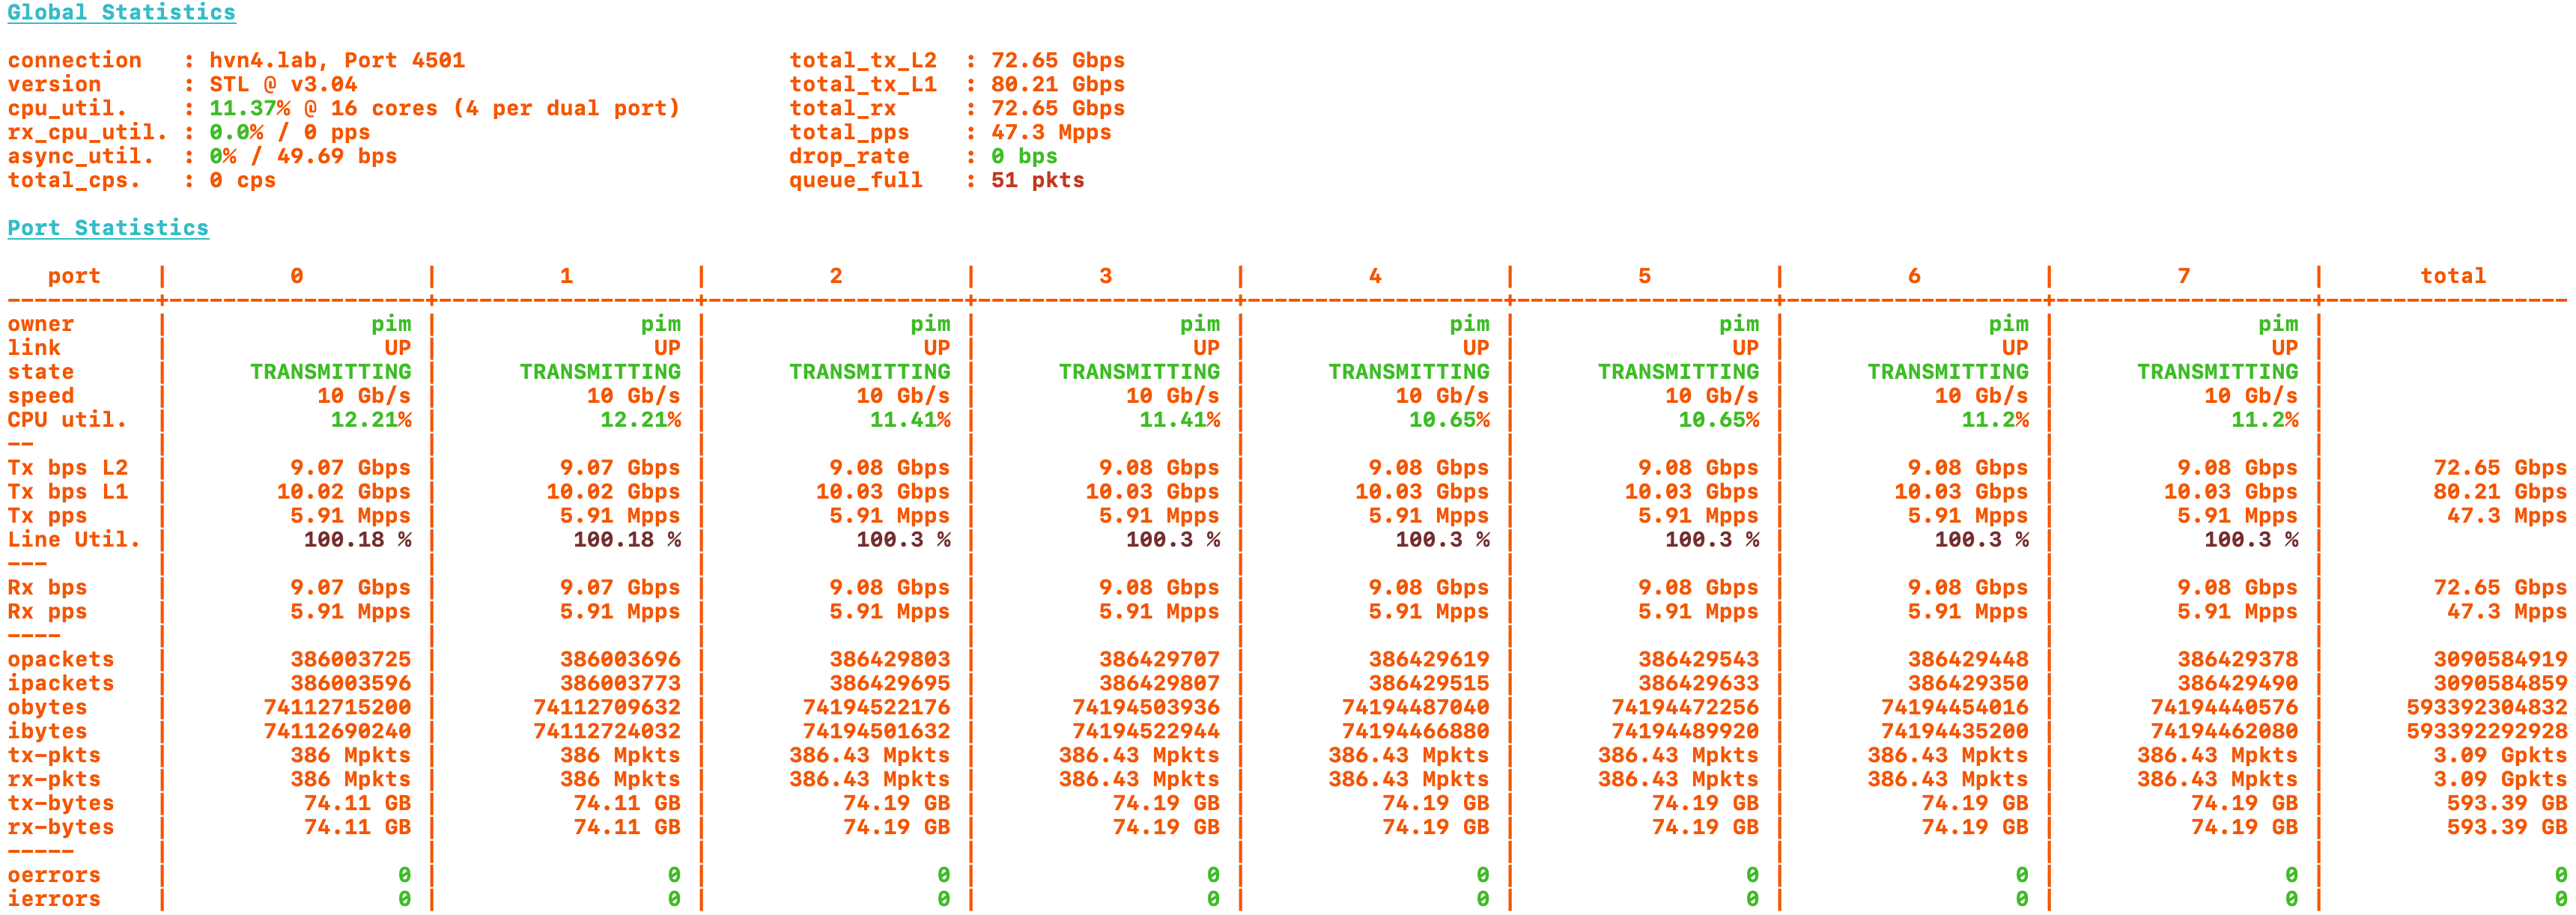
The leftmost ports p0 <-> p1 are sending IPv4+MPLS, while ports p0 <-> p2 are sending ethernet back and forth. All four of them have sFlow enabled, at a sampling rate of 1:10'000, the default. These four ports are my experiment, to show the CPU use of sFlow. Then, ports p3 <-> p4 and p5 <-> p6 respectively have sFlow turned off but with the same configuration. They are my control, showing the CPU use without sFlow.
First conclusion: This stuff works a treat. There is absolutely no impact of throughput at 80Gbps with 47.6Mpps either with, or without sFlow turned on. That’s wonderful news, as it shows that the dataplane has more CPU available than is needed for any combination of functionality.
But what is the limit? For this, I’ll take a deeper look at the runtime statistics by varying the CPU time spent and maximum throughput achievable on a single VPP worker, thus using a single CPU thread on this Hippo machine that has 44 cores and 44 hyperthreads. I switch the loadtester to emit 64 byte ethernet packets, the smallest I’m allowed to send.
| Loadtest | no sFlow | 1:1'000'000 | 1:10'000 | 1:1'000 | 1:100 |
|---|---|---|---|---|---|
| L2XC | 14.88Mpps | 14.32Mpps | 14.31Mpps | 14.27Mpps | 14.15Mpps |
| IPv4 | 10.89Mpps | 9.88Mpps | 9.88Mpps | 9.84Mpps | 9.73Mpps |
| MPLS | 10.11Mpps | 9.52Mpps | 9.52Mpps | 9.51Mpps | 9.45Mpps |
| sFlow Packets / 10sec | N/A | 337.42M total | 337.39M total | 336.48M total | 333.64M total |
| .. Sampled | 328 | 33.8k | 336k | 3.34M | |
| .. Sent | 328 | 33.8k | 336k | 1.53M | |
| .. Dropped | 0 | 0 | 0 | 1.81M |
Here I can make a few important observations.
Baseline: One worker (thus, one CPU thread) can sustain 14.88Mpps of L2XC when sFlow is turned off, which implies that it has a little bit of CPU left over to do other work, if needed. With IPv4, I can see that the throughput is actually CPU limited: 10.89Mpps can be handled by one worker (thus, one CPU thread). I know that MPLS is a little bit more expensive computationally than IPv4, and that checks out. The total capacity is 10.11Mpps for one worker, when sFlow is turned off.
Overhead: When I turn on sFlow on the interface, VPP will insert the sflow-node into the
forwarding graph between device-input and ethernet-input. It means that the sFlow node will see
every single packet, and it will have to move all of these into the next node, which costs about
9.5 CPU cycles per packet. The regression on L2XC is 3.8% but I have to note that VPP was not CPU
bound on the L2XC so it used some CPU cycles which were still available, before regressing
throughput. There is an immediate regression of 9.3% on IPv4 and 5.9% on MPLS, only to shuffle the
packets through the graph.
Sampling Cost: But when then doing higher rates of sampling, the further regression is not that terrible. Between 1:1'000'000 and 1:10'000, there’s barely a noticeable difference. Even in the worst case of 1:100, the regression is from 14.32Mpps to 14.15Mpps for L2XC, only 1.2%. The regression for L2XC, IPv4 and MPLS are all very modest, at 1.2% (L2XC), 1.6% (IPv4) and 0.8% (MPLS). Of course, by using multiple hardware receive queues and multiple RX workers per interface, the cost can be kept well in hand.
Overload Protection: At 1:1'000 and an effective rate of 33.65Mpps across all ports, I correctly
observe 336k samples taken, and sent to PSAMPLE. At 1:100 however, there are 3.34M samples, but
they are not fitting through the FIFO, so the plugin is dropping samples to protect downstream
sflow-main thread and hsflowd. I can see that here, 1.81M samples have been dropped, while 1.53M
samples made it through. By the way, this means VPP is happily sending a whopping 153K samples/sec
to the collector!
What’s Next
Now that I’ve seen the UDP packets from our agent to a collector on the wire, and also how incredibly efficient the sFlow sampling implementation turned out, I’m super motivated to continue the journey with higher level collector receivers like ntopng, sflow-rt or Akvorado. In an upcoming article, I’ll describe how I rolled out Akvorado at IPng, and what types of changes would make the user experience even better (or simpler to understand, at least).
Acknowledgements
I’d like to thank Neil McKee from inMon for his dedication to getting things right, including the finer details such as logging, error handling, API specifications, and documentation. He has been a true pleasure to work with and learn from. Also, thank you to the VPP developer community, notably Benoit, Florin, Damjan, Dave and Matt, for helping with the review and getting this thing merged in time for the 25.02 release.